Power BI and R can be used together in a variety of ways. One of the powerful aspects that R can bring into a Power BI report is predictive modeling.
Last week, I covered how to achieve this with R Visuals in Power BI report. This week, I will cover how to do this by running R Scripts in the Power Query Editor.
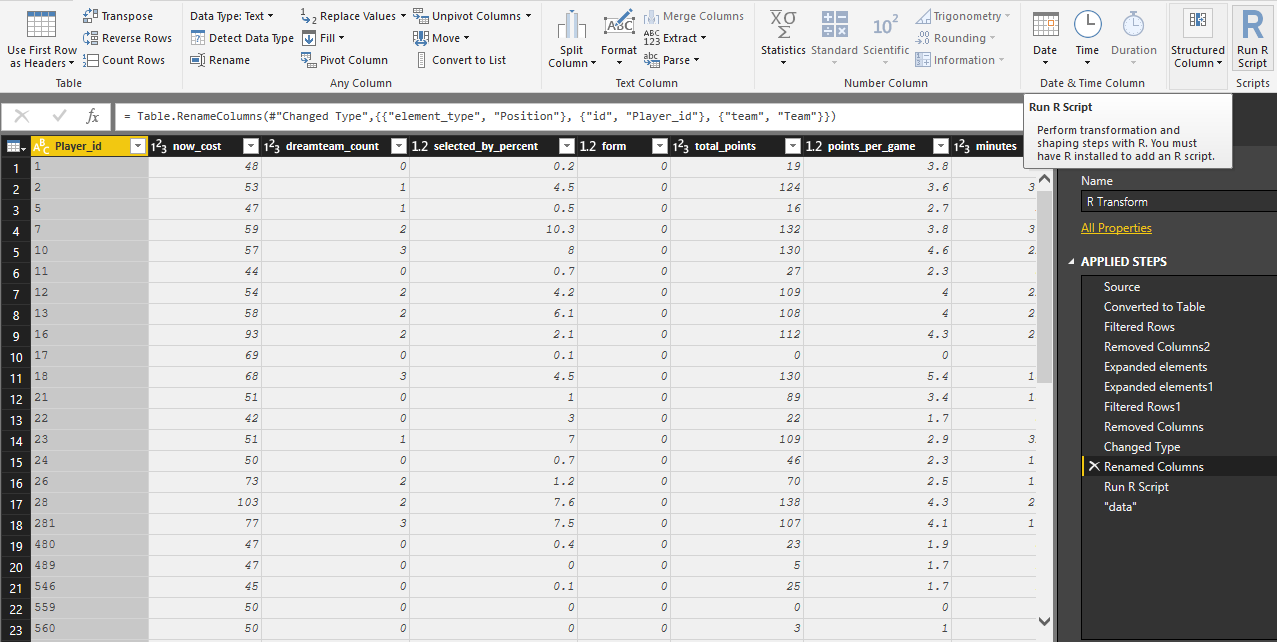
I used my Premier League Fantasy Football Power BI report. I started with a query that I had already built containing stats about player performance this past season.
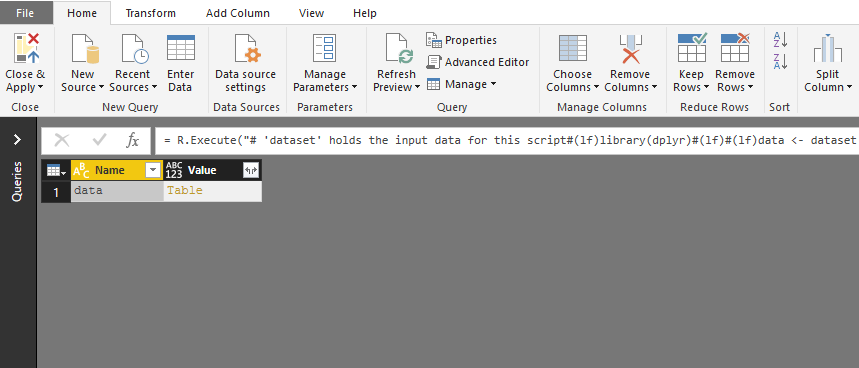
To create a predictive model on this data, I navigated to the Transform tab on the ribbon and selected Run R Script.
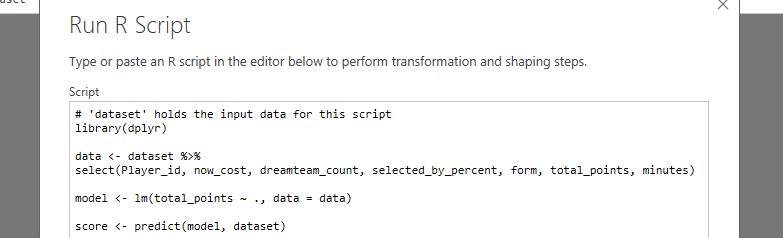
This opens the “Run R Script” pane where I could enter my script.
The first line loads the dplyr package.
library(dplyr)
The second statement filters the data set and only returns certain columns.
data <- dataset %>%
select(Player_id, now_cost, dreamteam_count, selected_by_percent, form, total_points, minutes)
The third lane of code creates the linear model. It predicts total points by all the other columns from the “data” object. It also defines the data argument as the “data” object.
model <- lm(total_points ~ ., data = data)
The fourth line of code applies the model on the entire data set.
score <- predict(model, dataset)
The fifth line of code creates a column in the data set named “score”, filling it with the “score” object.
dataset$score <- score
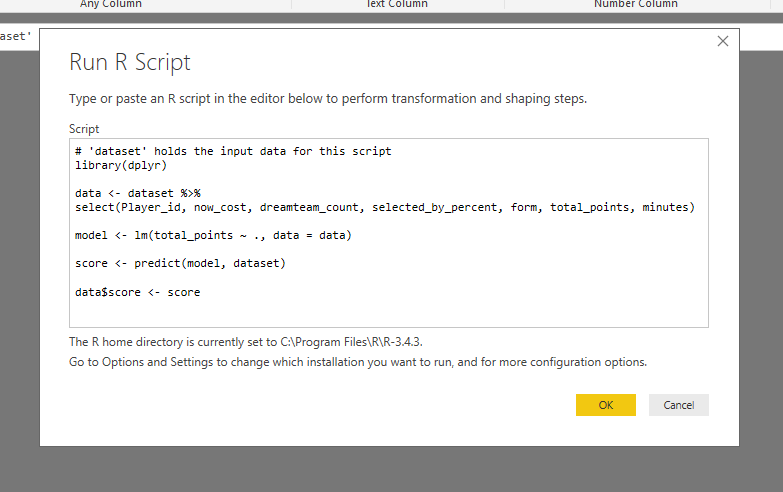
I hit OK, which raised an error message. This is similar to the data privacy warnings when combining other data sources in the Power Query Editor.
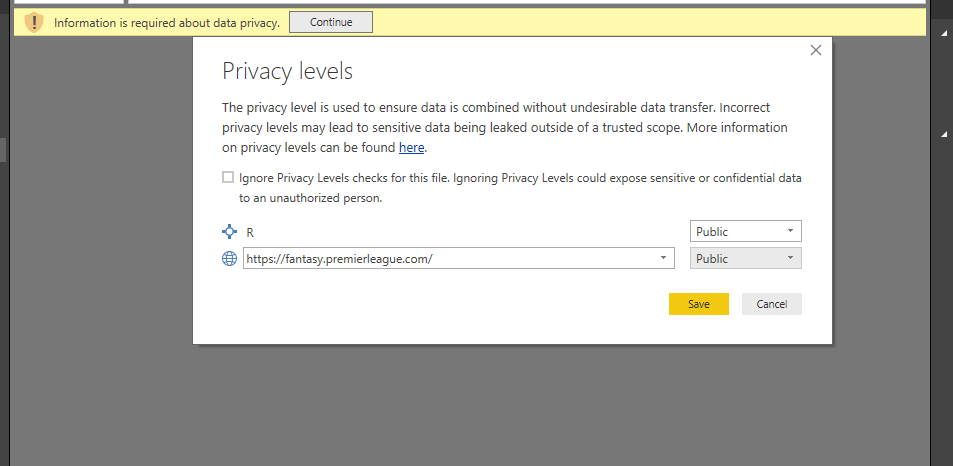
I set both privacy levels to public and continued.
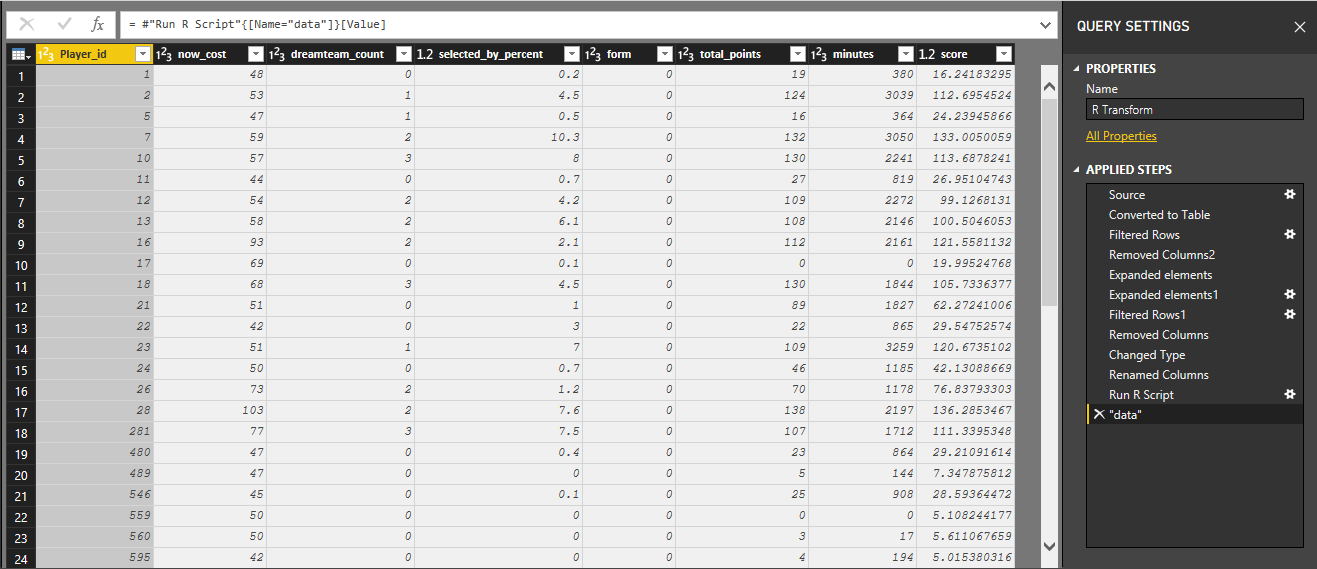
This loaded the “data” object I created. I expanded the table in the Value column to return the data.
This brought up the data set with only the columns I defined in the select() statement, as well as the new score column.
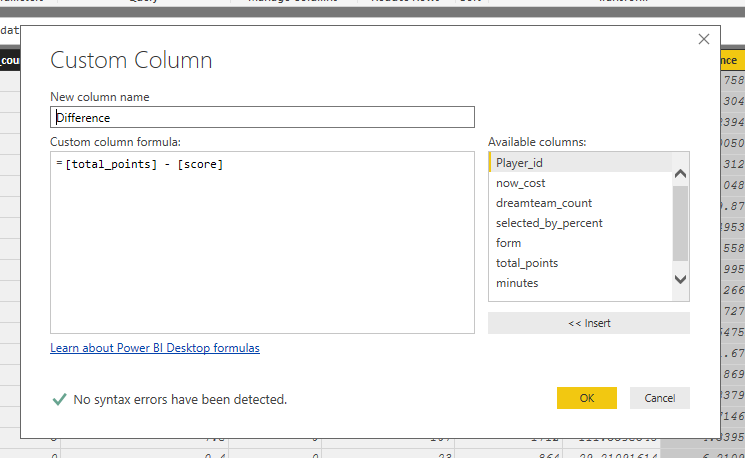
After running an R Script, I was still able to continue with data manipulation in the Power Query Editor. This could have been achieved in the R Script itself as well.
I created one custom column that calculates the difference between the actual fantasy points scored for the season and the predicted amount of points from the model.
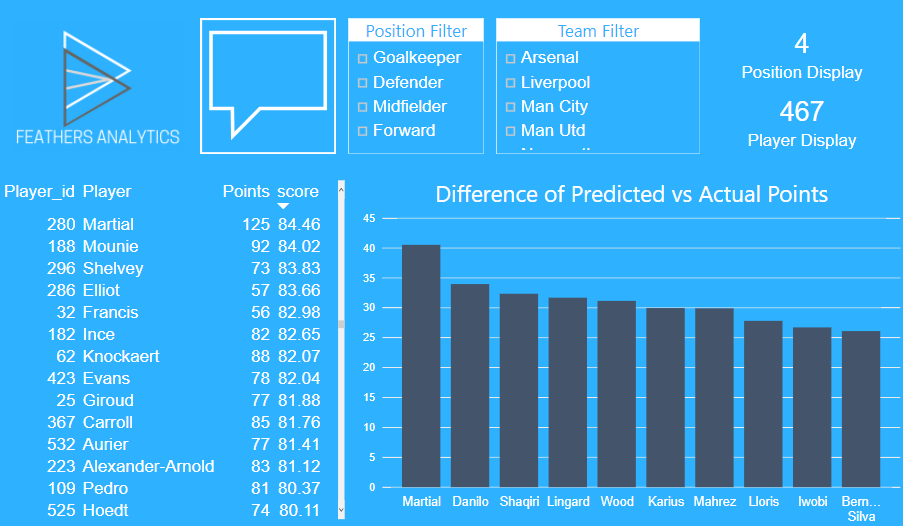
I loaded the data and built some visuals on the report canvas.
The main visual displays the difference in points predicts and actually scored by the players.
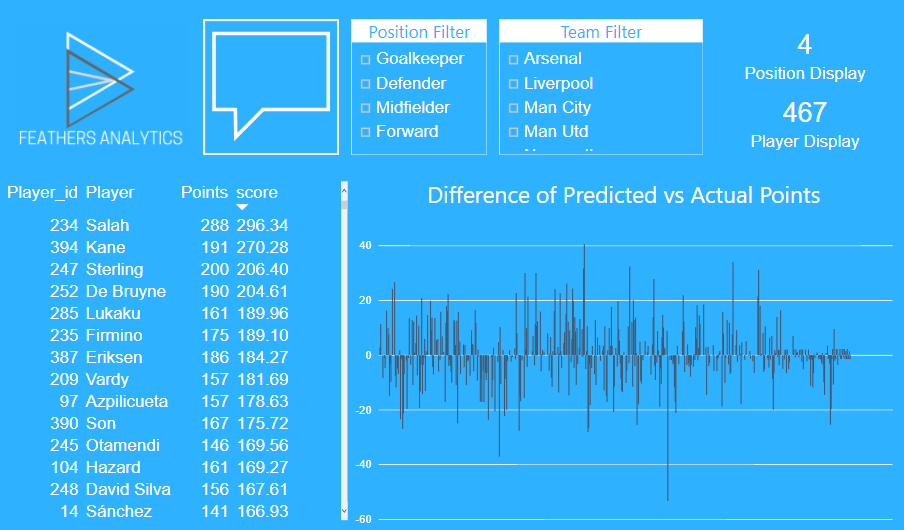
Then I focused on the top 10 players who outperformed their predicted points.
That’s the second way that R can bring predictive modeling into Power BI. A third way to bring this into Power BI will be covered next: R Script as a data source.
1 thought on “Power BI & R – Power Query Editor”
Comments are closed.