I’m excited to write a post about DAX for the first time in a while! I was faced with a scenario at work where I wanted to return either a single value or the count of values if more than a single value was returned in the filtered context.
I recreated this scenario on a different data set to demonstrate how I created the measure.
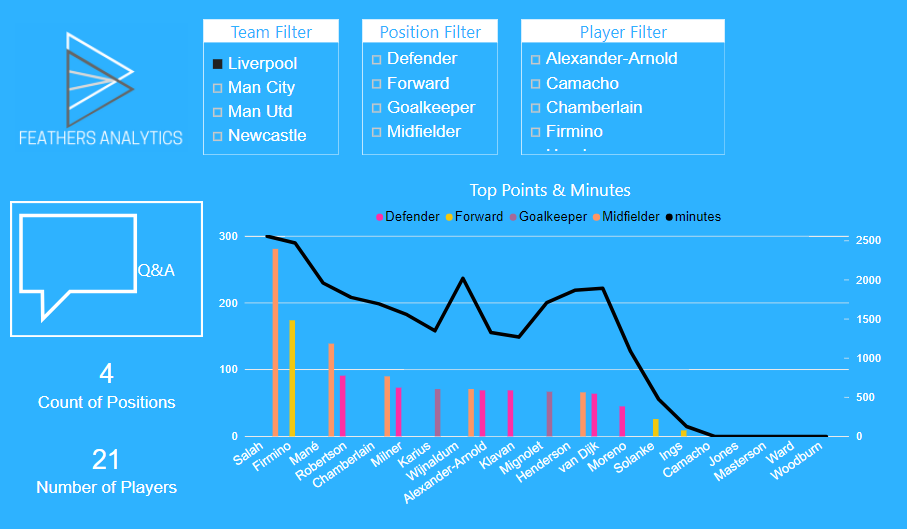
I started with a basic report I built using the Premier League Fantasy Football data set. I have filters for the team, position and player.
There is a combo chart visual that plots points scored and minutes played by player. There is also a legend that displays players by their position.
The most important aspect of the report is the two card visuals in the bottom left corner. They display two DAX measures I created: Count of Positions and Number of Players.
Count of Position calculates a distinct count of positions in the filtered context. Number of Players calculates the number of players returned in the filtered context.
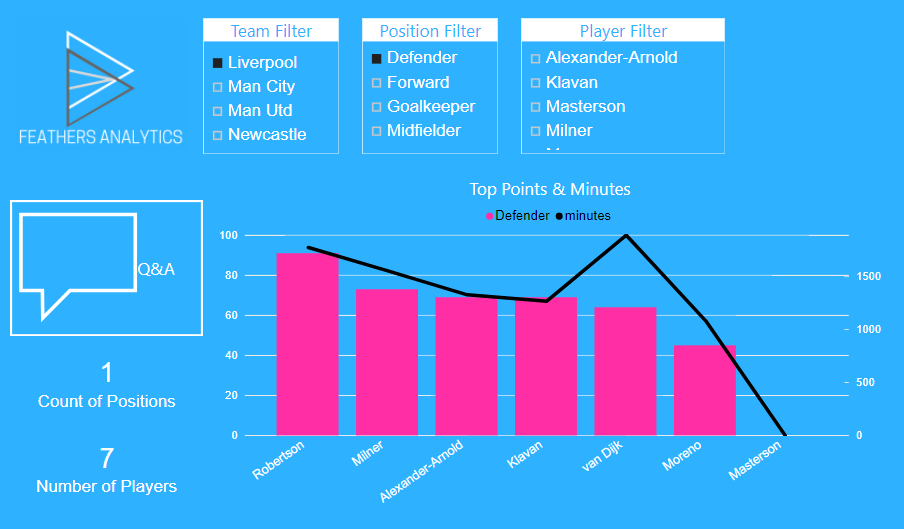
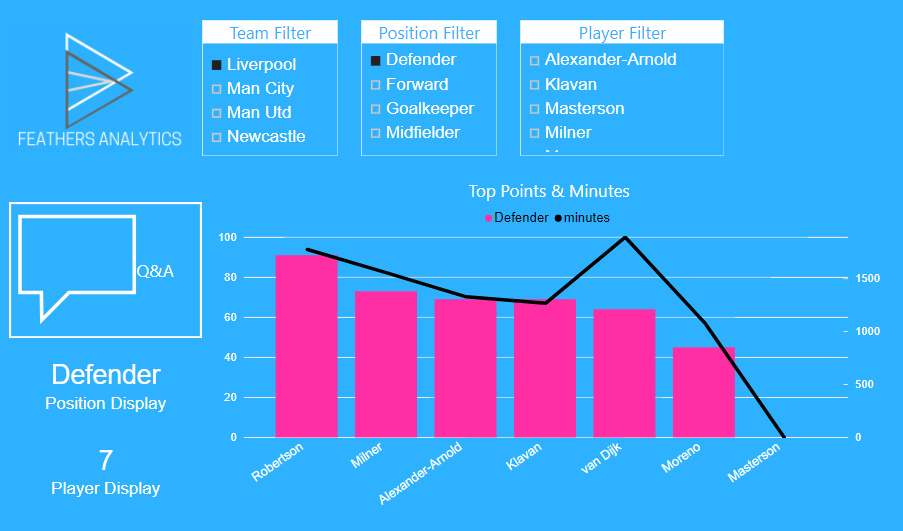
I already had Liverpool selected in the team filter. When I filtered the position to defender, the Number of Players card returned seven players.
The Count of Positions card returns one, as defender is the only position in the filtered context.
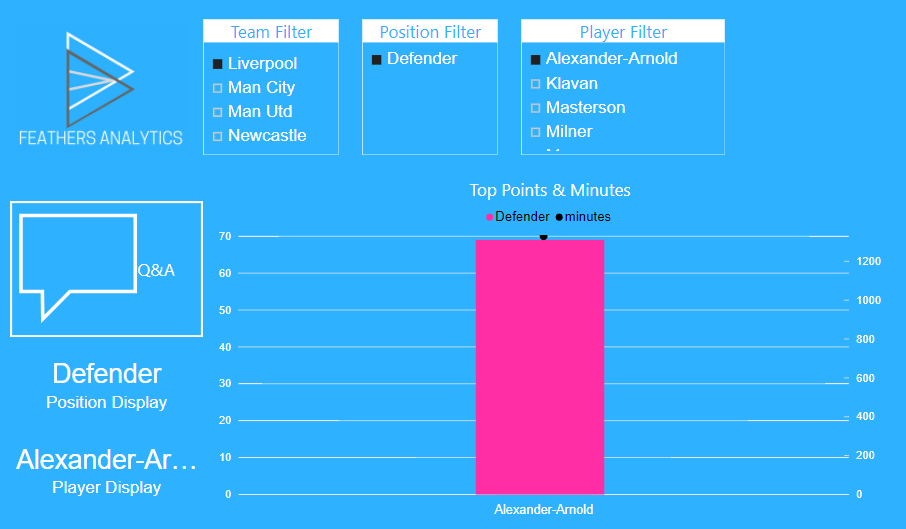
Then I filtered the player name to Alexander-Arnold. This results in the Number of Players card displaying one as well as the Count of Positions card.
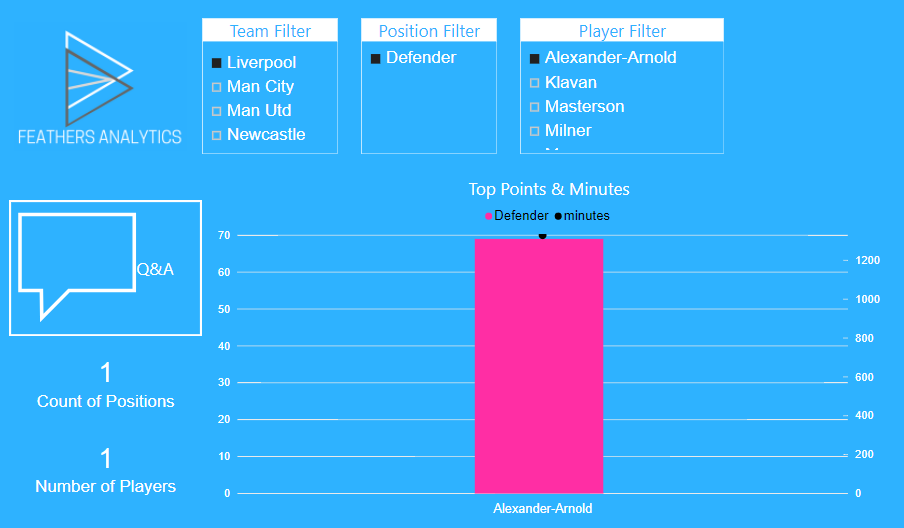
Ideally, when the Card visual counts return a value of one, they would display the single position or player name, rather than the count.
I was able to create a new DAX measure to achieve this!
I leveraged the IF() function and the FIRSTNONBLANK() function.
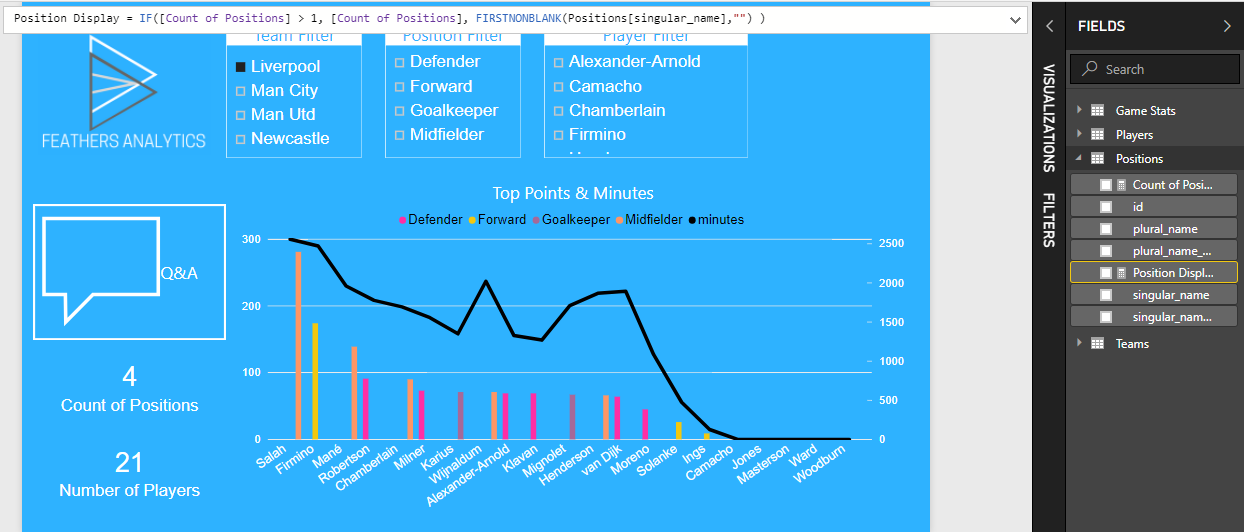
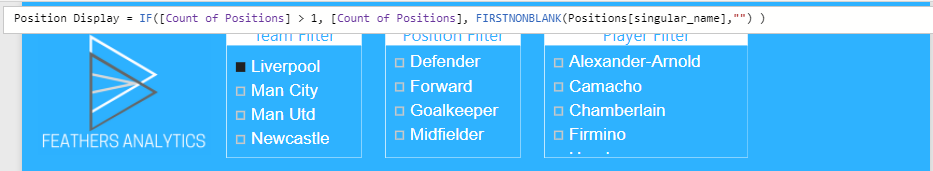
The code for the position display is:
Position Display = IF([Count of Positions] > 1, [Count of Positions], FIRSTNONBLANK(Positions[singular_name],""))
This measure tests to see if the number of distinct positions returned in the filtered context is greater than one. If it is, it returns the distinct count of positions.
If there is only one distinct position in the filtered context, it returns the first non blank value from the name column of the positions table.
I created a similar measure for players as well.
Now when position is filtered to defender, the card displays “defender”, rather than a count of one.
When I filter player name, the same thing happens and the card displays the player name.
I loved that I was able to achieve this with one DAX measure, rather than having to stack card visuals with different measures!
I have started to create DAX measures more frequently for my Power BI reports, rather than relying on implicit measures.
They allow a greater degree of flexibility and control over the data in a report. I’m looking forward to blogging about DAX more often in the future!