I recently had a requirement for a Power BI report to generate a forecast. The report data model consisted of daily amount information, which was aggregated and summarized in the report for monthly totals.
The data was current year to date, but for the remaining months in the year rather than displaying no data, the users wanted to impute the average for all of the previous months that did have data.
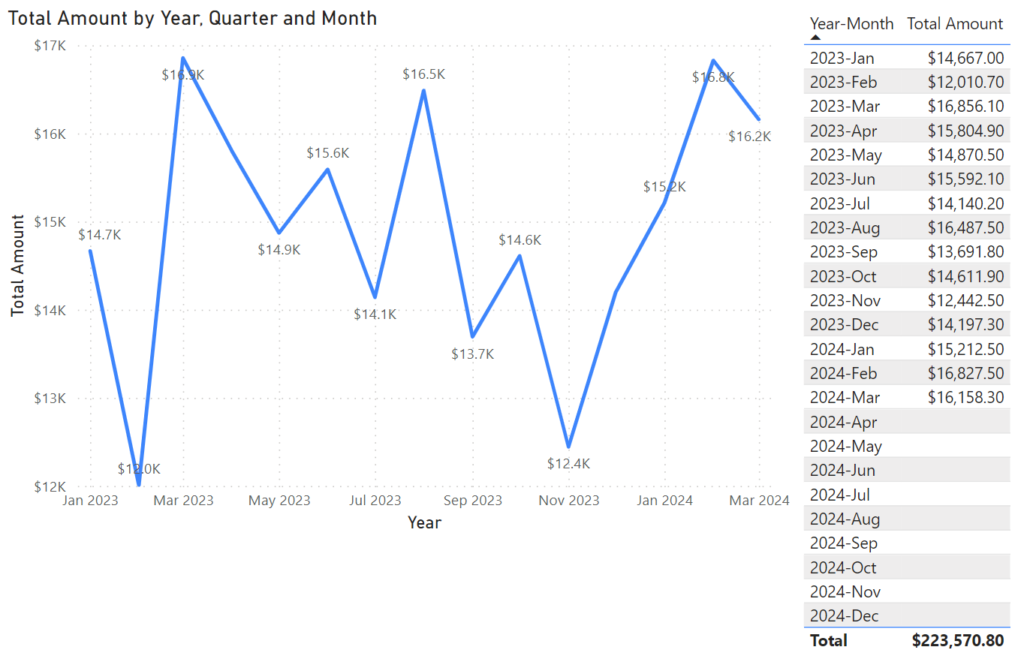
The beginning state of the report contained a line chart and table visual that tracked Total Amount over the past fifteen months. I enabled the “show items with no data” option on the table visual to illustrate the future months with no total amount information.
The first step was to create the average that would be used to impute the forecasted value for the future months. I couldn’t just compute an average on the Amount column of the fact table, as the forecast had to be at the month level and the data model contained daily information. So I used AVERAGEX() to calculate the average of [Total Amount] for each unique month.
Avg Amount =
AVERAGEX ( VALUES ( 'Date'[Year-Month] ), [Total Amount] )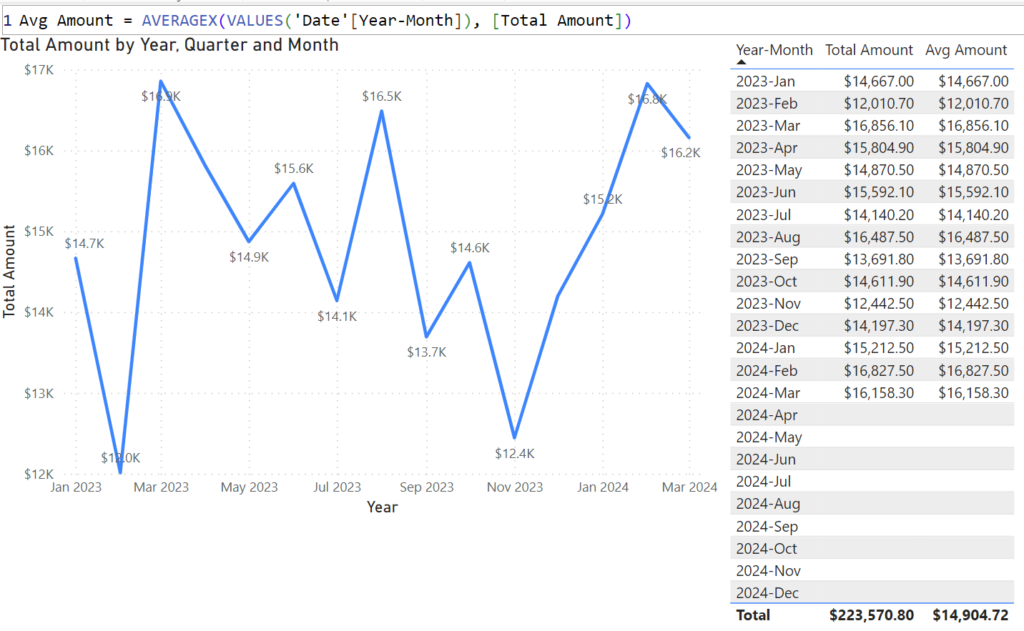
It doesn’t look like anything really happened, but take a look at the column total. The [Total Amount] column sums all of the row values, but the [Avg Amount] column takes the average of the rows. This is the value that I want to impute for each blank row.
To do this, I created a test measure. Since there was no underlying data related to the future months, I used ALLSELECTED() to remove the context filter applied from the rows in the table visual.
All Selected Test =
CALCULATE ( [Avg Amount], ALLSELECTED ( 'Date' ) )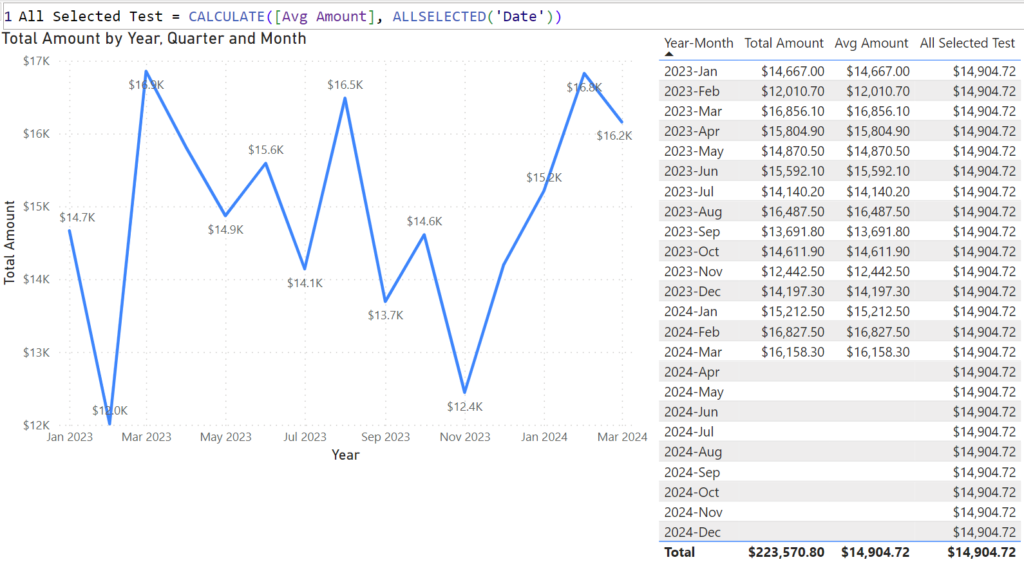
The test measure returned the same value for each row, including (and importantly) for the future months.
Finally, I needed to create a conditional measure to return the original [Total Amount] measure where it exists, and the new [Avg Amount] with ALLSELECTED() for the future months.
Actual or Forecast =
VAR _avgamt =
    CALCULATE ( [Avg Amount], ALLSELECTED ( 'Date' ) )
VAR _cond =
    IF ( ISBLANK ( [Total Amount] ), _avgamt, [Total Amount] )
RETURN
    _cond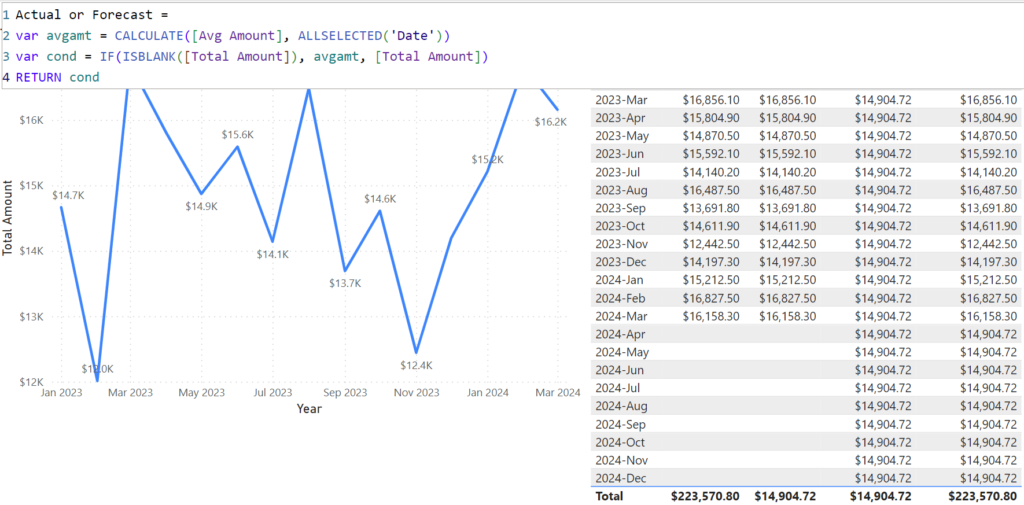
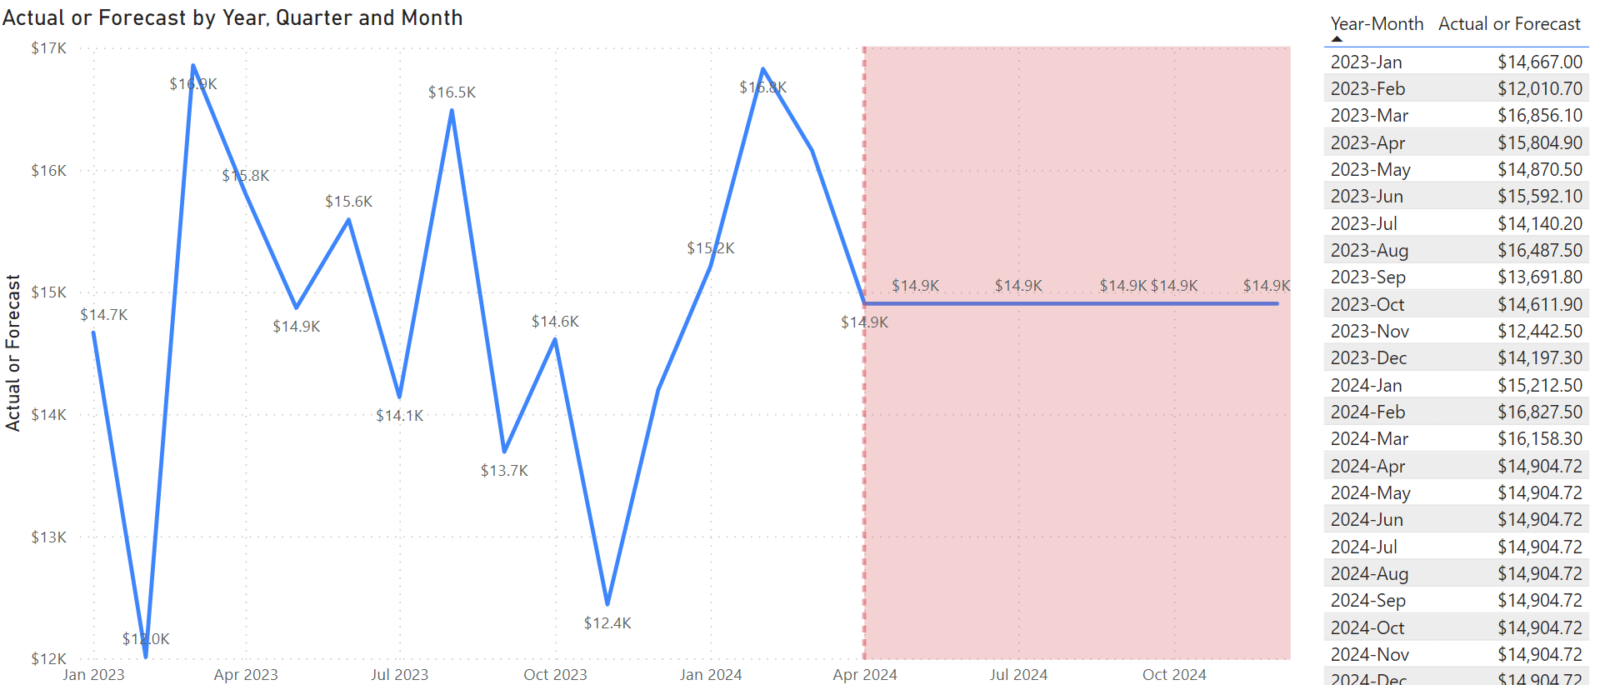
We can see from the table visual that the new Actual or Forecast measure returns the same values from column one of the table where they exits and the values of column three for when they do not.
I finalized the report page by removing the intermediate DAX measures from the table, updating the line chart with the new Actual or Forecast measure, and added some additional formatting to the line chart.
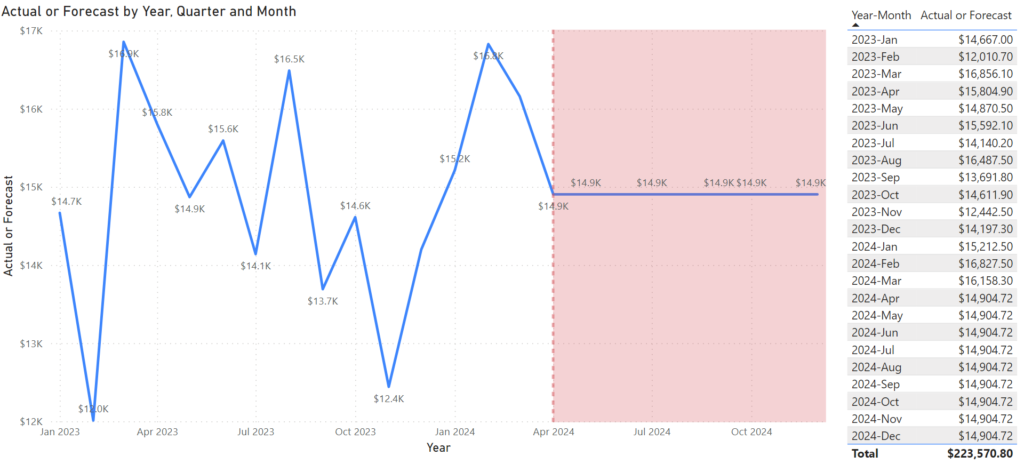
What’s nice about this solution is as new data comes in, both the actuals and forecasted values will update automatically. Months that previously contained a forecasted value will now have actuals, which in turn will update the Avg Amount measure to calculate the forecast for future months.