I was recently re-watching my Power BI Mixtape: Vol. 1 presentation and recalled a question from the audience as I was going through one of my Power Query demos. They suggested that I could update my solution to split a column by a line feed special character – and they were correct! I have outlined my previous approach to the demo in this post here:
As a quick recap, in this example I connected to an online data source and my goal was to have a simple table with three columns:
- FSA
- City
- Location within the city
The source data was in a matrix format, with data repeated across rows and columns in a table. Within each cell, there were three “levels” of information that correspond to the three columns I want in my clean table.
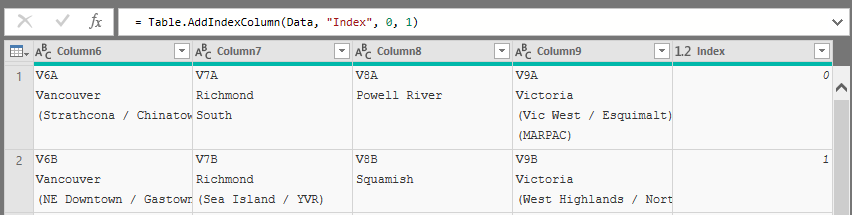
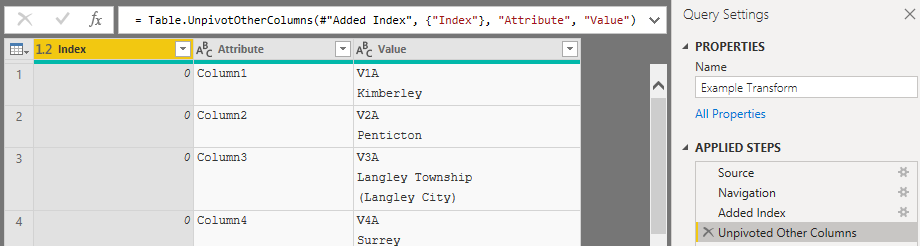
Starting from the matrix, with repeated cells across columns and rows, I first consolidated all of the information I needed into a single column. Then I removed the other columns. This left me with a single column of data – each row containing three lines of information that I wanted to split into columns.
At this point, in my previous solution, I removed the line feeds so that all of the information in each cell was on a single line. I then had to rely on a few different patterns to correctly split my data into three columns.
The solution worked, but it was a bit complicated and there were a few edge cases to account for.
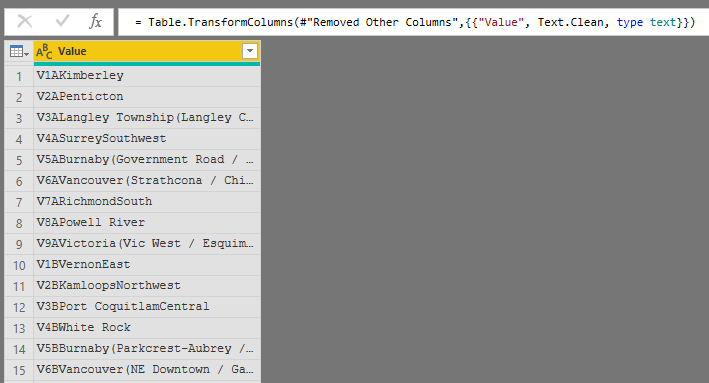
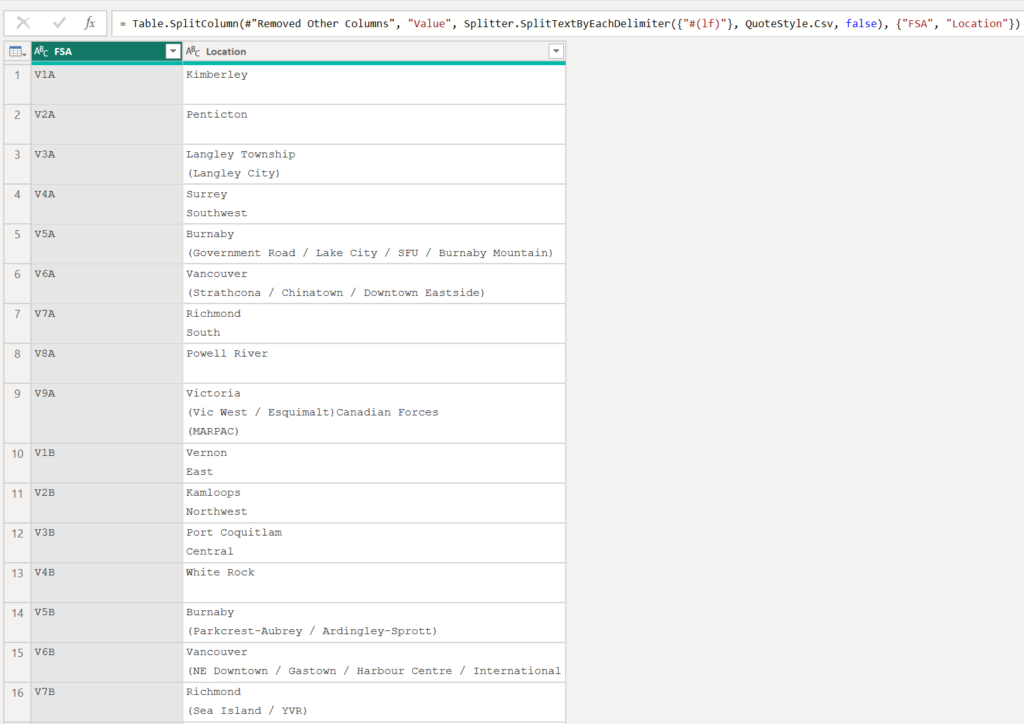
To simplify my transformation, rather than using the Text.Clean function to remove the line feeds within each cell and THEN starting to try and split the strings, I leveraged these line feeds to split the column.
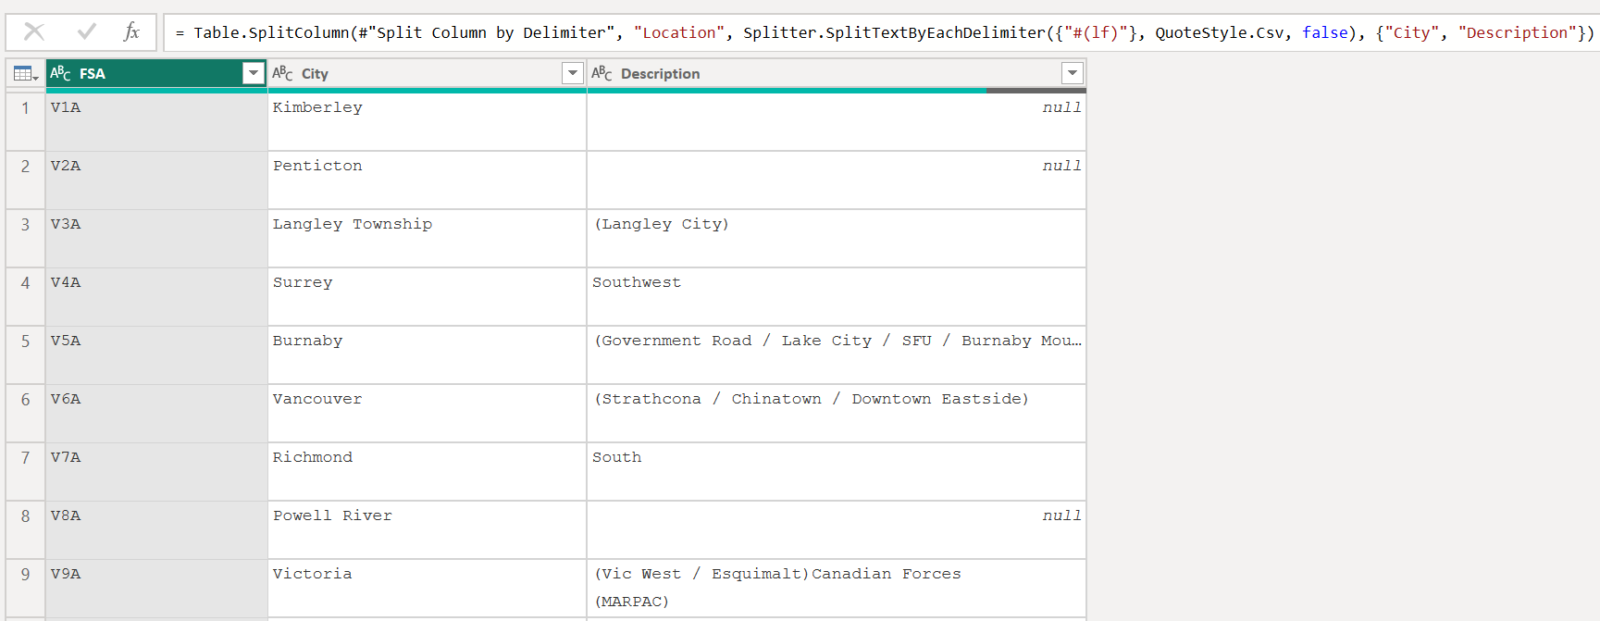
I started by splitting the source column by the first line feed "#(lf)" character. This gave me my first clean column for the forward sortation area.
I repeated this process to finalize the two additional columns that I needed: the city and a description.

Finally, I used the Text.Clean function to remove any remaining line feeds.
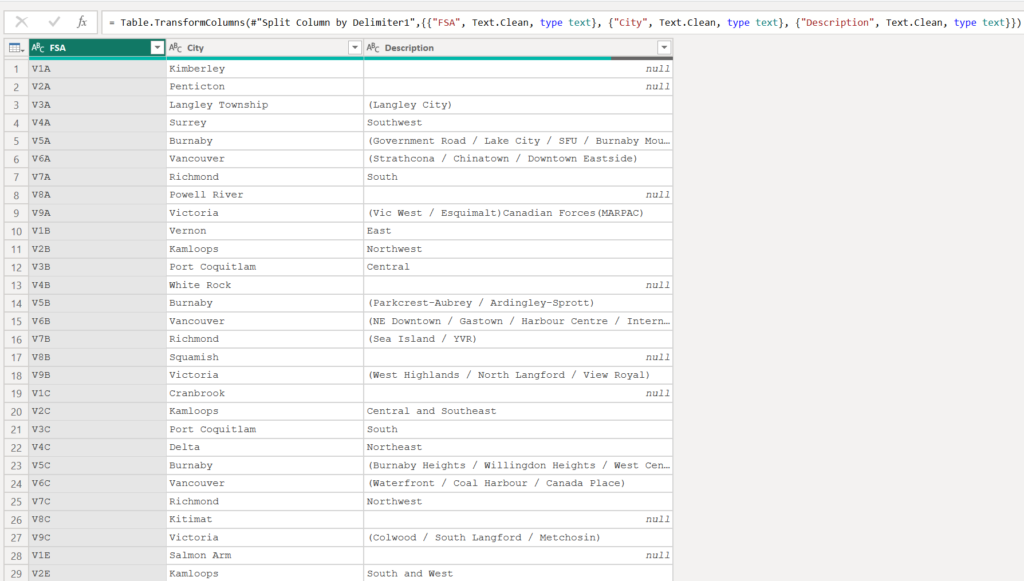
This got me to the same tidy data source for my report, but with transformation steps that were easier to read, audit, and maintain.