This topic was inspired by one of the examples in my session: Prep Your Data for Analytics with R & Power BI.
This first post will review building a query to transform a data set and prepare it for analytics and visualization. The second post will cover how to convert this query into a function that can be applied on multiple data sets of the same structure.
I began by connecting to the data source. I wanted to extract a data set from the Wikipedia page containing a list of urban forward sortation areas in British Columbia.

I navigated to the first element on the web page. This contained a table with information about urban forward sortation areas.

The table was structured in a matrix format. There were multiple columns containing the same information about FSAs and their related locations.
This needed to be tidied up so that all of the information of one type was contained within one column. The method I used to achieve this was to unpivot the data. This would combine multiple columns of data into one that contained all of the information needed for analysis.
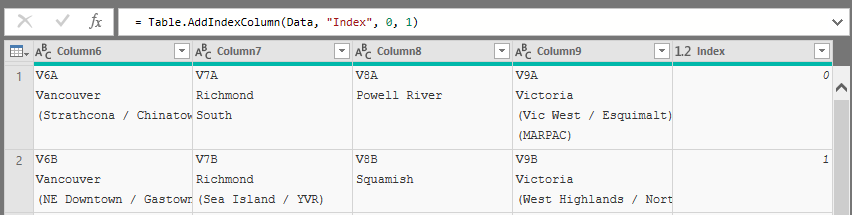
The first step was to create an index column.

Then all of the other columns in the table were unpivoted.
This transformed the table, resulting in three columns:
- an index column
- a column containing the previous column headers
- a column containing all of the data that was previously spread out

The first two columns were no longer needed for the rest of the analysis, so they were removed.
This left one column containing the FSA and the corresponding descriptive information.

The table of one column needed to be split back into multiple columns. The first pattern I noticed was how every row started with the three character FSA and was followed immediately by the city in which it is located.
This made the initial split straight forward, as the column can be split after the first three characters.
This split resulted in a table with two columns:
- FSA
- Location information

Things were starting to look pretty good! I noticed that some rows in the second column contained a city and other rows contained a city followed by additional location details. This column should be split, so that there is one clean column containing the city name and another column with any additional details.
I noticed a second pattern in the data. The additional details where often contained in parentheses. I extracted the information from between parentheses into its own column.

This was a good start, but some additional information still remained in the city column.
This is when I noticed a third pattern: I always wanted to split the text string where there was a camel case. This was due to =Text.Clean() function earlier in the applied steps that removed line feeds from the contents of the column.
This split resulted in a table with four columns.

There were now two clean columns: FSA and city. The other two columns contained essentially the same information: additional location detail about the FSA.
To solve this, I merged the two columns using no separator.

This left me with the exact structure I was looking for. A table with three columns containing:
- FSA
- City
- Location within the city
My clean up was done! The next step is to convert this query into a function, so it can be applied to clean up data pertaining to other provinces in Canada.