I was recently tasked with creating a cross sales report. This report aims to capture the product penetration across our customer base.
I created the report in Power BI, leveraging Power Query to ensure that the information would be driven from two source tables in our CRM system.
The Power BI report and Excel Workbook from this post can be found here. To view the report, you will be prompted to enter the file path of the downloaded folder containing the example files.
For this post, the tables are in Excel, but this method can be replicated when extracting data from any source.
The two tables I used for the report are:
- Account table: this lists all of the active accounts for our customers and includes the open date of the account as well as the product type
- Customer table: this lists all of our customers and their start date


My first step was to create a connection to the Excel workbook that was to be the data source for my report. This initial connection query listed all of the tables contained within the Excel workbook.

From here, I referenced this connection query to create two source queries that corresponded to the two tables in the workbook.
Referencing the account query, I created three staging queries:
- List of unique customers who own at least one account
- List of unique products
- List of the earliest account open date for each product for each customer
This third staging query was important for customers who had more than one account in a product category. I wanted to capture the date of the earliest cross sale.


Now I had everything that I needed to create the final query to drive the report.
The first step was to create a cross join between the customers and products staging query.
This returns every possible combination of customers and products. This will be important when visualizing which products have not been cross sold to particular customers.
I achieved this by referencing the Customers staging query and creating a custom column. The formula for the column was simply:
= Products
This returned the full Products staging query for every row/customer. The I expanded the complex column to return each combination of customer and product.

I then merged the earliest open date for each product that a customer held. A null date means that the customer does not own an account for this product category.

My second step was to calculate the difference between the customer start date and the open date for each product. I did this by returned the duration in days between the two columns.

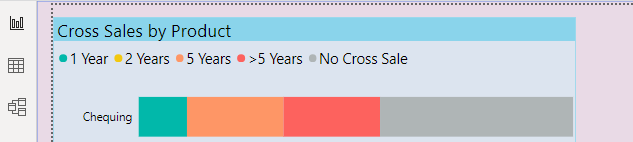
The number of days isn’t that helpful, so I binned this calculation into six groups:
- 90 Days
- 1 Year
- 2 Years
- 5 Years
- >5 Years
- No Cross Sale

At this point I created a sort column to help when I visualize the binned “days to cross sale” calculation.
I did a final cleanup by removing the columns I would not need for my report.
After extracting, transforming and loading the data I created a stacked bar chart visual for my report.

The axis had the various product groupings, the legend has the binned days to cross sale column.
Each of the bars have the same length as I created a category for “No Cross Sale”.
1 thought on “Cross Sales in Power BI”
Comments are closed.