I recently completed a workshop on dimensional modeling and I am really excited to blog a bit of a summary of what I have learned. I was able to immediately apply some of the knowledge gained to one of the reporting dashboards I have been working on. I enjoyed being able to transfer some concepts from the theory of the classroom to a practical application.
One of the reasons I was able to take advantage of this workshop so quickly is because dimensional modeling is business process oriented and has a bottom up design. This means that you do not have to take a lot of time to plan your architecture before beginning to build. As you add business processes to your model, you can leverage the design you already have in place. This allows you to continuously build as new requirements or processes emerge. This type of development is particularly appealing to me, because I am slowly (but surely!) introducing dashboards to my organization. As familiarity and comfort grows so too will requirements. Using Kimball methodology to build and model my data will allow me to be quick in development and decrease my turnaround time.
I will outline a brief, high level view on the process on dimensional modeling and then explain how this was applied to my visual report in Power BI.
Select the Business Process
The first step in dimensional modeling is to select the business process to model. The business process I have selected to model is an issue tracking system. We have recently built a new system in-house and I volunteered to build reports off of the new database. In the system, an issue is created and assigned to a user and a user department. These two fields are dynamic and can change as employees work on the issue. Each issue also has a service level agreement, status, type, and create date field. Every issue is associated with one or many action items. These action items track employee work on an issue. Each action item has a user, type, create date, and time worked field.
Declare the Grain
The second step in dimensional modeling is to declare the grain of the fact table. This is what the entire model is based on. The grain is what one row of the fact table will represent. This determines which dimensions and facts you will build and include in your model. I have selected one row per action item for my model. This means that I am starting my model at the most granular (or atomic) level. Beginning at the atomic level is best practice because it is easy to aggregate data to a coarser grain for future fact tables. It will also give you the most flexibility for handling changing and new reporting requests!
For example, if a user wanted information at the issue level (which is less granular than the action item level I have selected) I can aggregate the action items for each issue to give information at that higher level. This is much easier than having to rebuild the model at a finer grain! Anticipating requests and questions of the data in advance can save a lot of time in the long run.
Identify the Dimensions
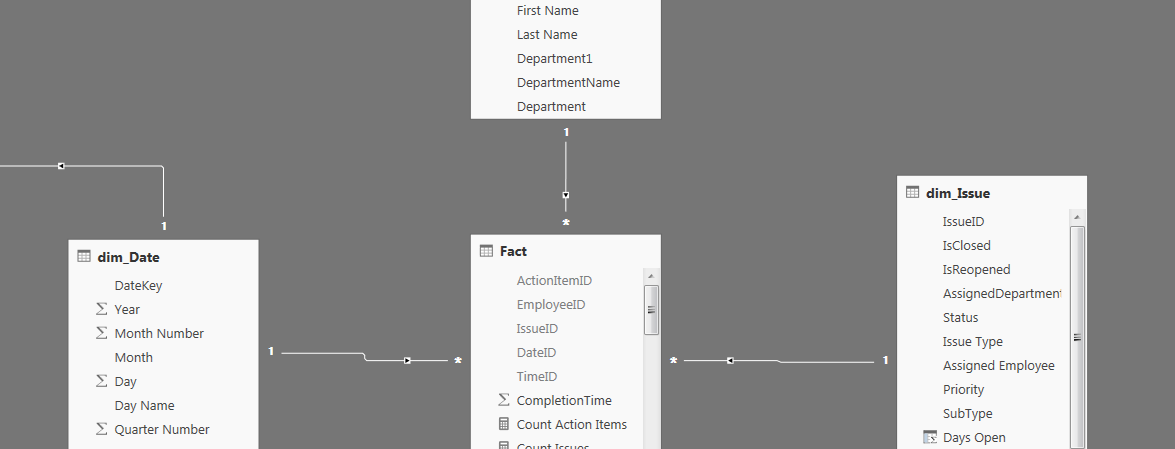
The dimension tables of the model allow you to describe the business process. They help give context to your analysis and will be used for filtering your fact table. Dimension tables are typically wide and short. They have many fields but a smaller amount of records. After reviewing the business process of issue tracking, it is clear that I need four dimensions:
- Date
- Action Item
- Issue
- Employee
A date dimension is needed in every dimensional model. Every row of the fact table should be time stamped with a date key that relates to a date dimension. The date dimension contains fields that will let a user filter the data by almost any date logic. This can include day of week, workdays, weekends, quarters, months, years, time of day, or season. Again, it is best to include all types of date fields imaginable to address any possible future request.
The Action Item, Issue, and Employee dimension tables all contain fields providing additional information of the action item for the issue ticket. These fields will allow me to answer questions such as:
“Which employees worked on Issue #100378? How many minutes were spent on this issue? How does this compare to the average time spent on issues? How many employees worked on this issue outside of the assigned department?
Identify the Facts
The fact table contains the measures used to analyze the data. Fact tables are typically narrow and long, containing few fields and many records. Fact tables contain a foreign key connecting to each their related dimension tables. The facts in my model were related to two key measures:
- Time Spent on Issues
- Count of Issues
These two key points of analysis were provided by the business stakeholder. I built a variety of DAX measures to satisfy the need to analyze the data through these two perspectives. This included change over time and to date measures as well as various filtering, summing, and counting measures. I chose to “hide in report view” all of the foreign keys of the fact table. Hiding these fields can help eliminate confusion when building measures or filtering your data.
So there it is; dimensional modeling in Power BI! I had previously attempted to model this data differently, but my measures were not working as I had anticipated and my model was getting large and messy. Dimensional modeling allowed me to build a simple, easy to understand star schema that worked like I had envisioned.
I will touch on building dimensional models as part of my presentation on Power BI Tips & Tricks at this month’s Vancouver User Group. I will also try to get a blog post up next week containing the visuals and an outline of my presentation. I have been attending user group meeting for just over a year now and am excited to finally be presenting at one!
1 thought on “Dimensional Modeling”
Comments are closed.