
I recently had to pull together some numbers from across multiple data sources to create a trend report. All of the data was in one of our multi-dimensional Analysis Services models except for one key field: a household identifier. I used Power Query, connecting to both Analysis Services and SQL Server, to make this previous manual report available for refresh. This means that the time I spent building my queries and models can be leveraged in the future.
My first step was to connect to a SQL Server database to pull the customer identifier and their corresponding household identifier. I defined my SQL statement under the Advanced options, as I knew I only needed three fields and the statement would be quick and easy to write.
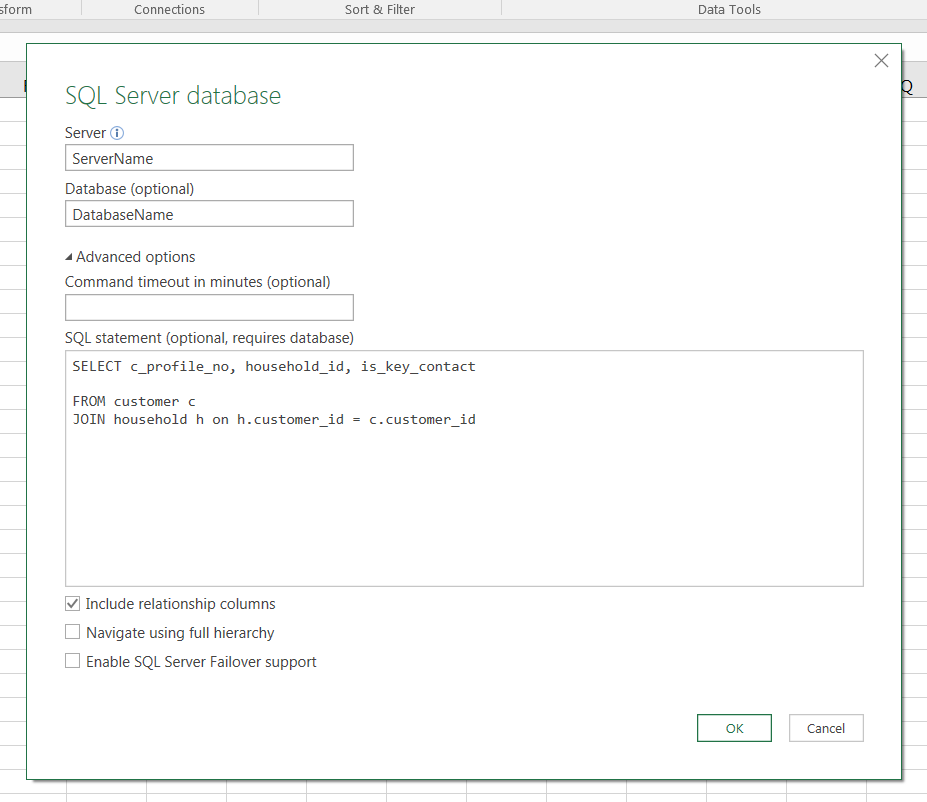
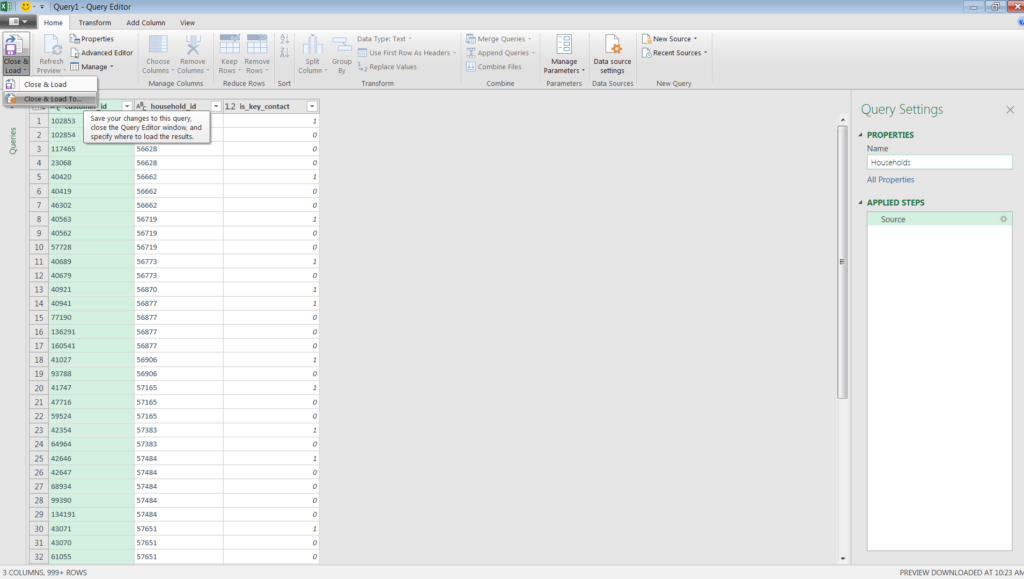
There is only one applied step as I defined my data in my SQL statement connecting to the SQL Server. This saved me time as I did not have to navigate through the interface to find the three fields that I needed in my model.
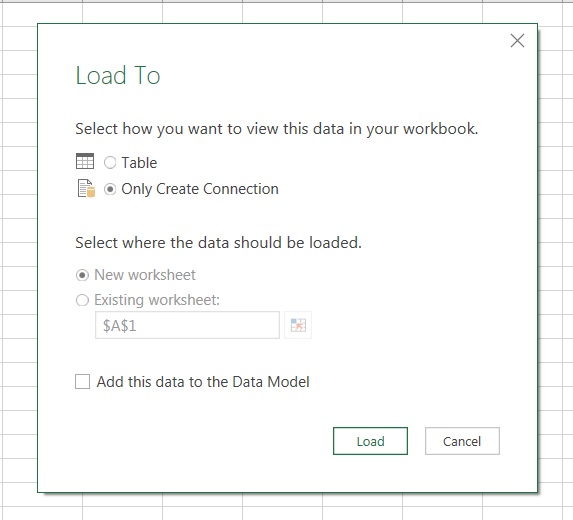
I do not need to analyze this data and load it in my workbook, as I will only be using it in a subsequent query. Therefore, I chose to load to “Only Create Connection” as opposed to the default Table.
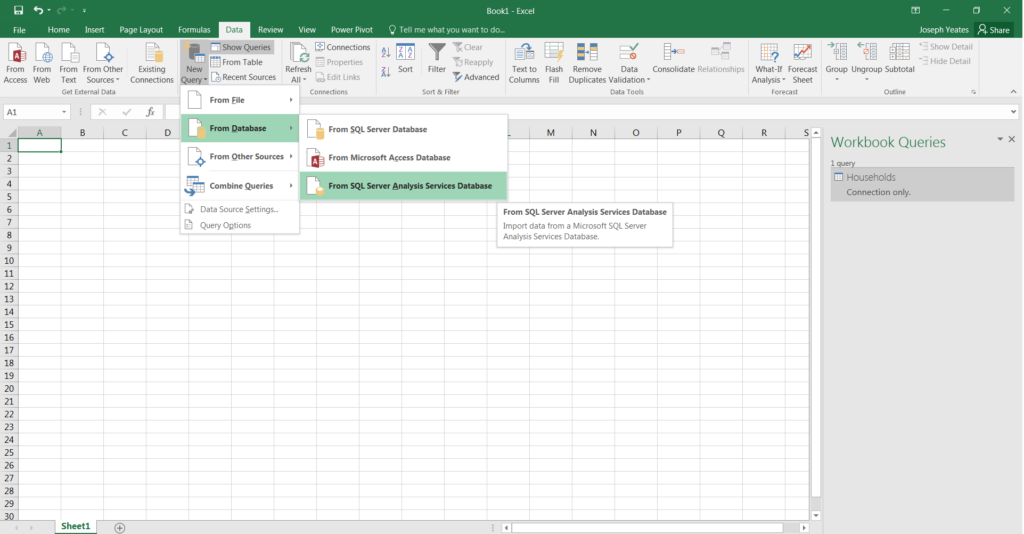
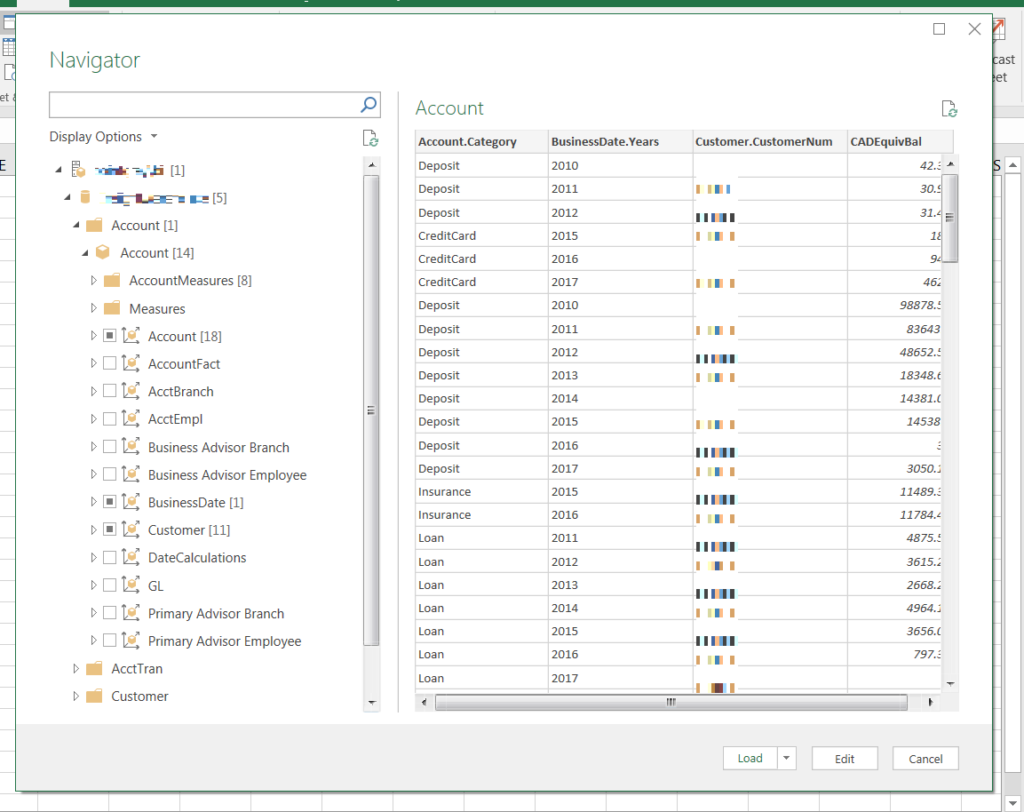
My next step was connecting to my second data source: SQL Server Analysis Services database. This had the bulk of the data that I need for my report.
This time, I did not provide an MDX statement. Instead, I selected which fields I wanted through the interface. I selected the Category field from the Account dimension, the Years field from the Business Date dimension, the CustomerNum field from the Customer dimension, and then CADEquivBal as the measure.
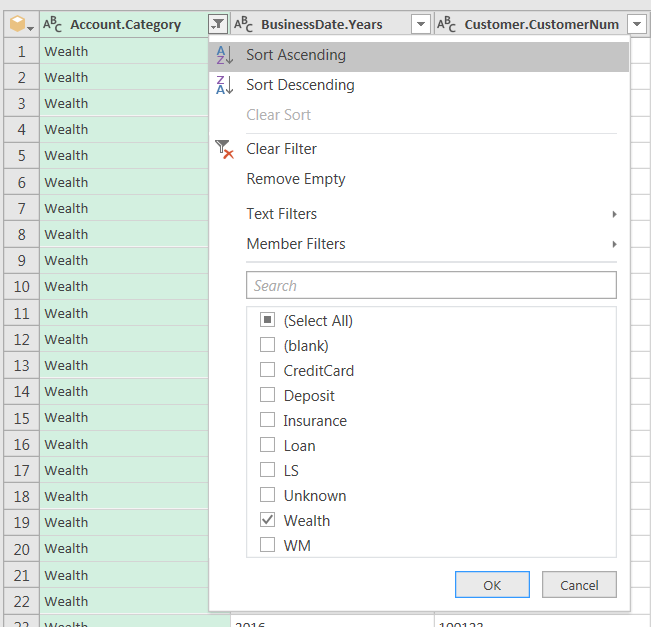
I loaded these fields to the Query Editor. For this report, the only product category that needed to be included was Wealth. I filtered out all other product types and then removed the Account.Category column.
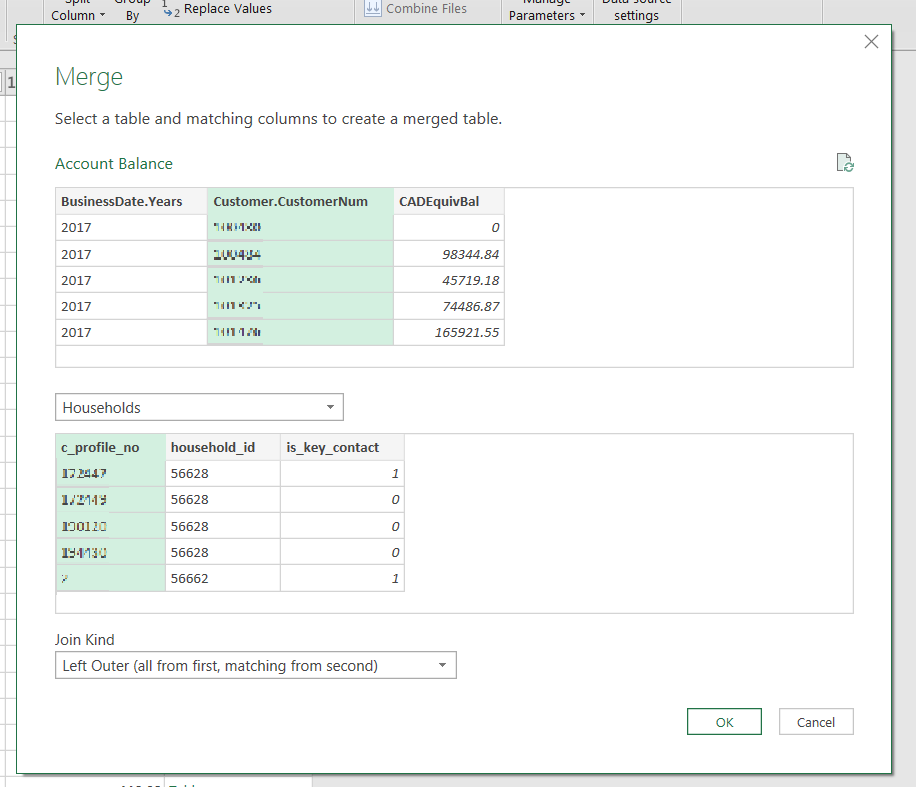
Now that I had filtered the customer data, I needed to group customers by their household. I had connected to this data earlier, so I merged my Account Balance query with my Households query with a left outer join from CustomerNum on c_profile_no.
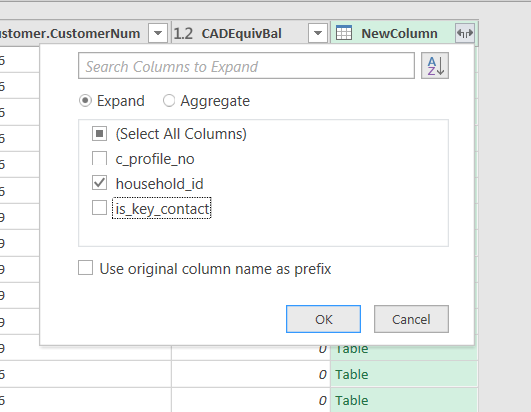
After I merged my queries, I expanded the NewColumn field. I only selected the household_id, as it was the only field that I needed. I also unchecked the “Use original column name prefix”, as I did not need that information in my column header.
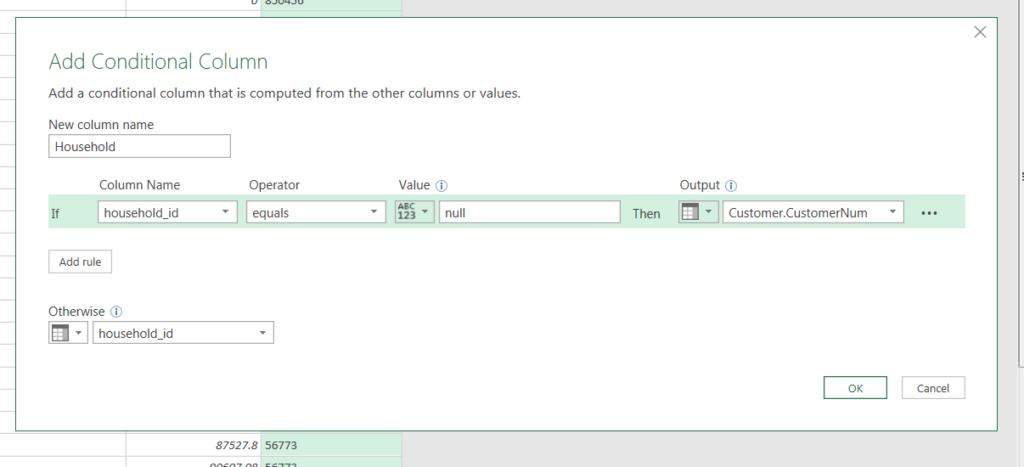
I now had the balance for every customer per household per year. However, I encountered an issue that some customers had a null household identifier. I solved this by creating a conditional column that returned the customer identifier if the household identifier was null. For the purposes of my report, this means that every customer who does not have an associated household identifier becomes their own household.
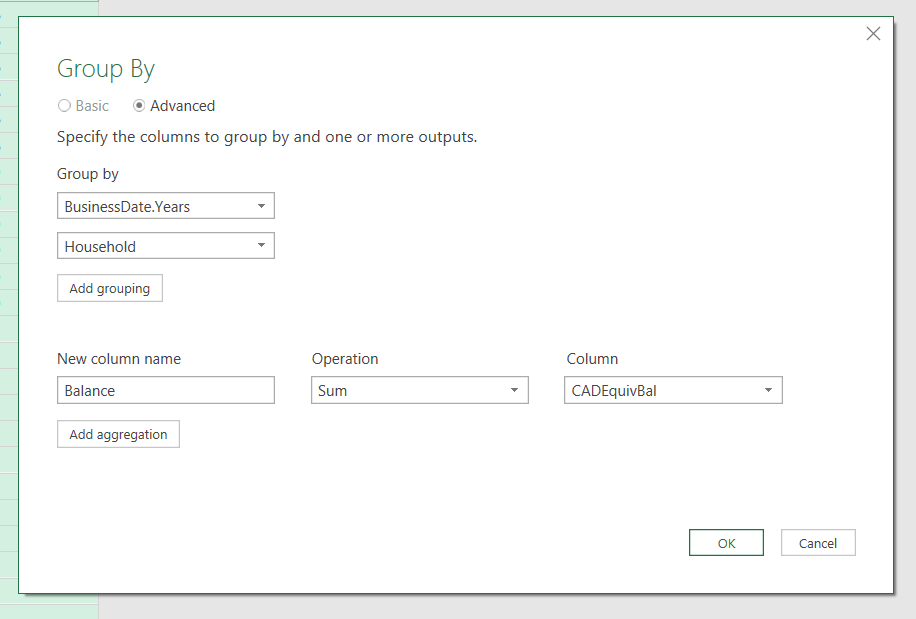
After I created the custom household field containing no null values, I removed the source household and customer columns. This left me with three columns: Household, BusinessDate.Years, and CADEquivBal. I still had multiple balance records per household per year, as more than one customer can be included in a household. Therefore, I needed to group by rows on household and year. I wanted to sum the CADEquivBal field to give me the sum balance for a household per year.
I loaded my query to the workbook and there you have it! A report that extracts data from multiple sources, transforms the data with filtering, custom columns, and grouping, and loads to a workbook that can be refreshed with the latest data. A previously manual and “unmaintainable maintainable” report made automatic with Power Query.