The second part of my Premier League Fantasy Football series! This post incorporates one of the aspects I prepared for my presentation next week on R Visuals in Power BI where I will be introducing R and building R script visuals in Power BI. I am using the same fantasy football data set for my presentation and thought it would be worthwhile to blog about a topic I have not covered yet: the web data connector in Power BI.
The need to use this connector came up as I wanted to plot the location of each team in the Premier League on a map visual. Rather than relying on the geocoding of city names or trying to find coordinates and copy them into a table, I decided to connect to an online source directly that contained all the data I needed. To achieve this, I needed a list of stadiums with their location, which I found on Wikipedia.
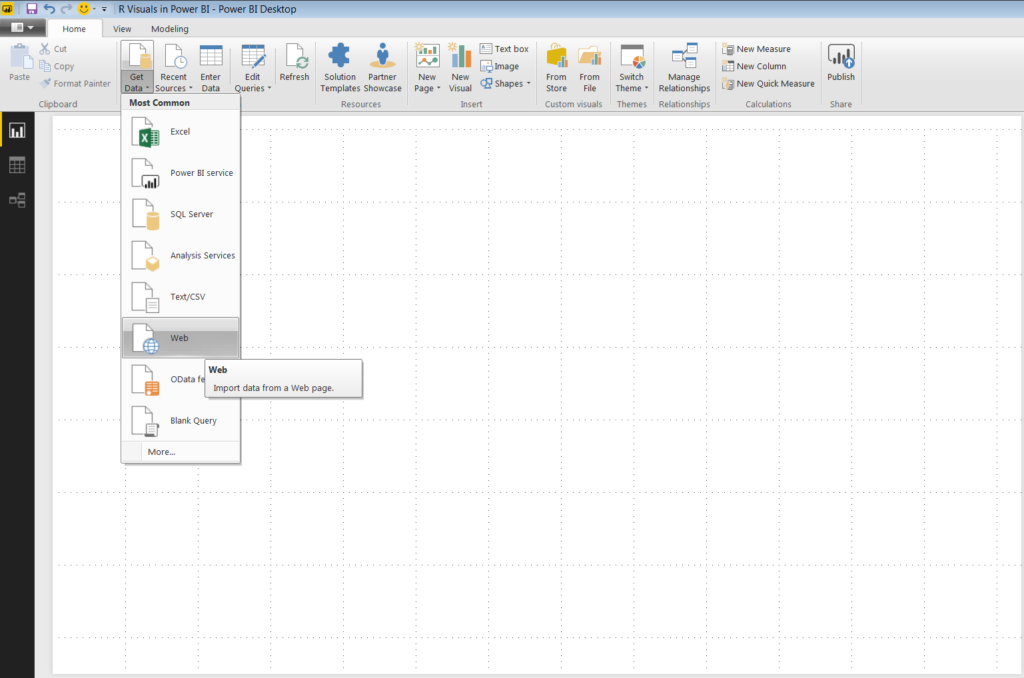
In Power BI Desktop, I went to Get Data and selected the Web option.
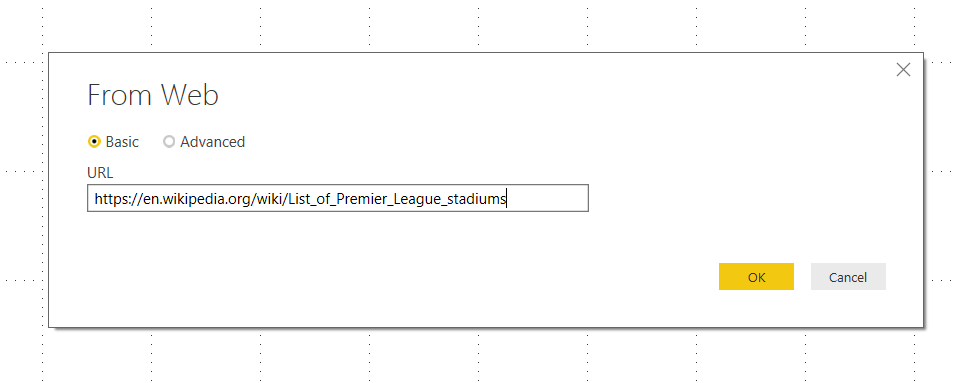
From there I entered the URL of the web page that contained my stadium data. I did not choose advanced options for this step, as I wanted to see the options provided to me with just the Basic URL.
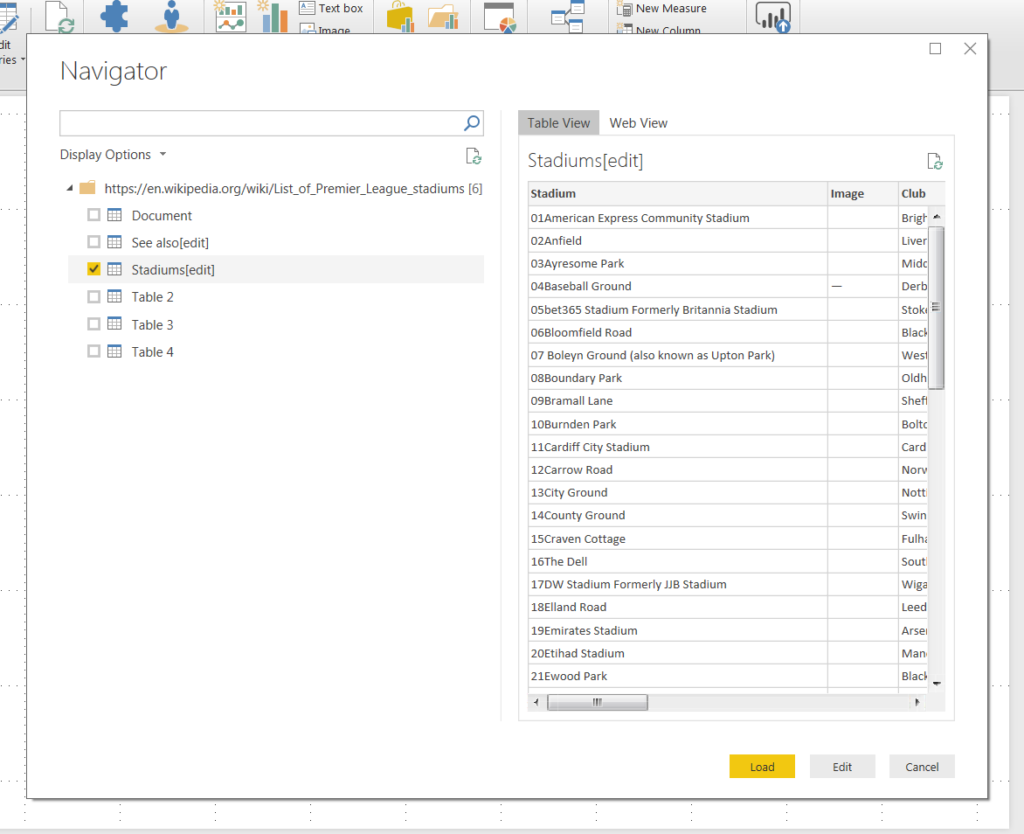
The Navigator window provided six tables to connect to based on the URL. The Stadiums[edit] table contained columns named stadium name, club, city and coordinates. This seemed like the data I needed, so I selected this table as my source and opened in the Query Editor.
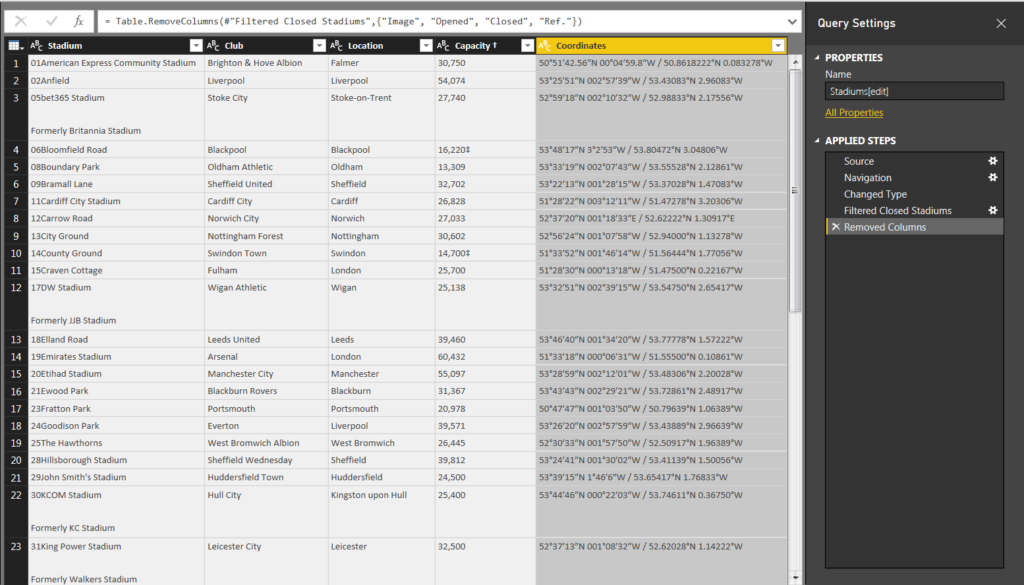
My first step was to filter out stadiums that are closed and not currently used, as my goal was to plot the current Premier League stadiums. There was a Closed column in the data set which contained the date when the stadium closed. I filtered this column to only return null values. I did not need the Image, Opened, Closed and Ref columns, so I removed them.
This left me with five columns: Stadium, Club, Location, Capacity and Coordinates. The Coordinates column includes coordinates in both degree minutes seconds and decimal degrees.
I did not need both types of coordinates to plot my data. I wanted to separate the two coordinate types so I could delete one of them. I achieved this by splitting the Coordinates column by the ” / ” delimiter. This left me with two coordinates columns: Coordinates.1 in DMS and Coordinates.2 in dd.
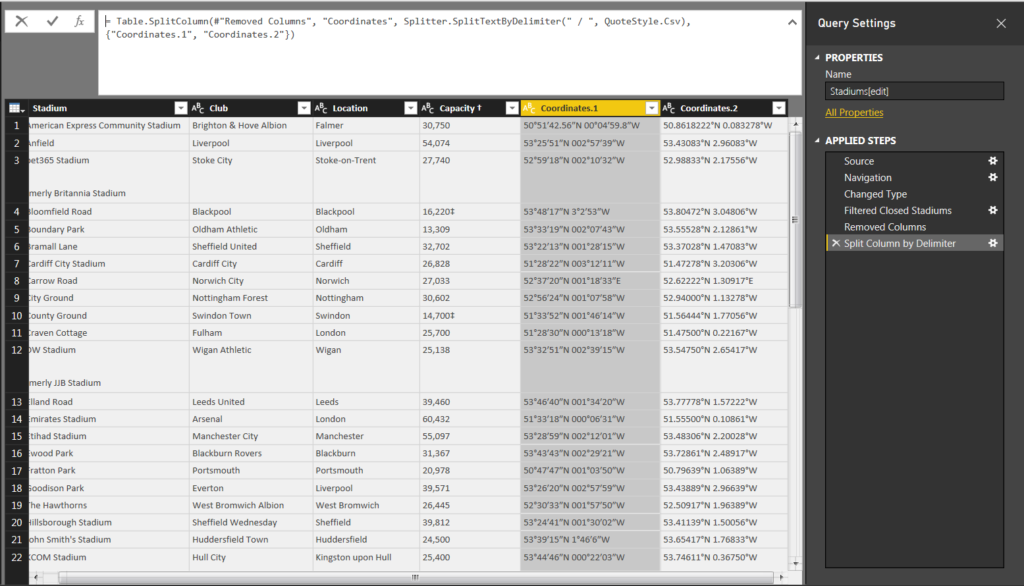
I deleted Coordinates.1 which left me with only one coordinates column. I split this column again, this time by the space delimiter, in order to have a latitude and longitude column.
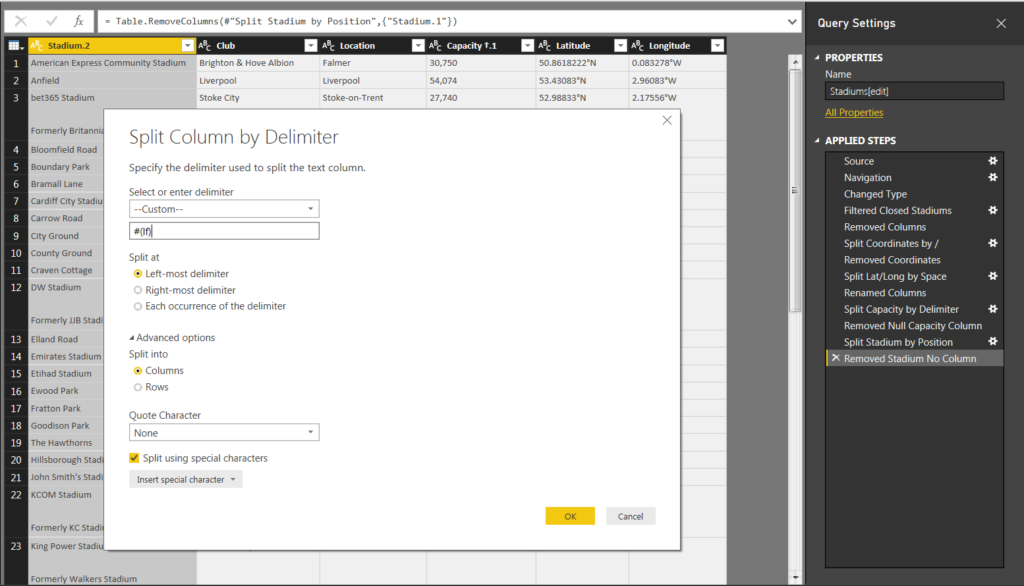
Now I had the fields needed to plot the stadiums on a map, I proceeded with some final cleaning of the data. The main issue I wanted to fix were the extra line feeds in both the stadium and club columns. I deleted this extra space by splitting the column by delimiter again, this time using a customer delimiter and selecting special character #(lf).
I finished cleaning my data and was almost ready to load into the report. One problem remained: I had a list of stadiums for all teams that had been in the Premier League since its inception as opposed to only the current teams.
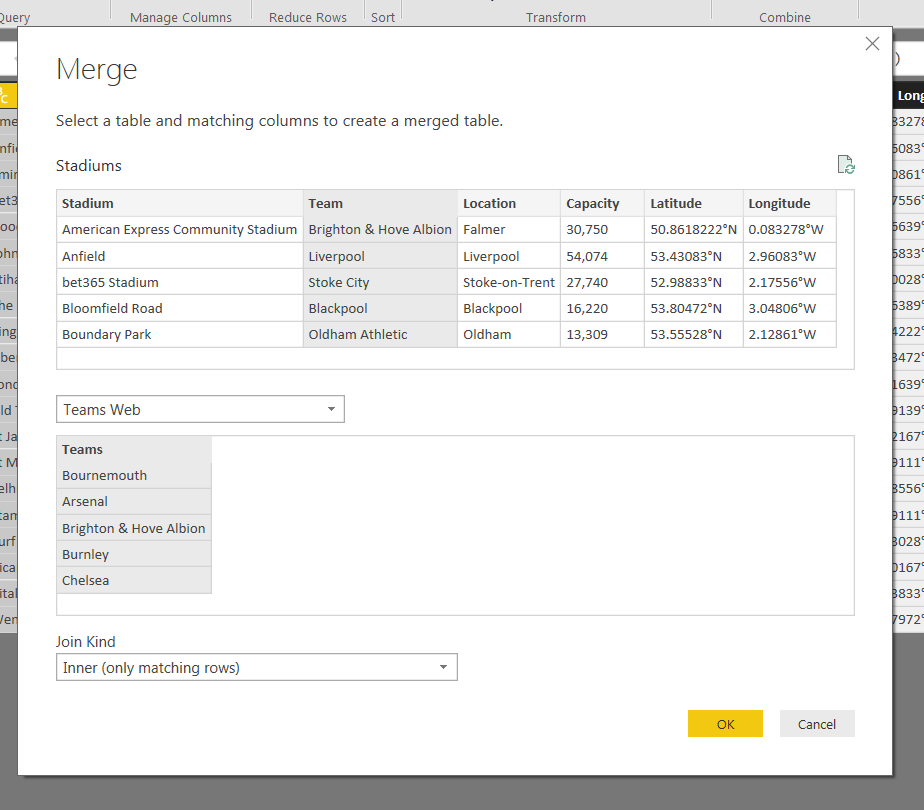
This could be fixed by filtering the Team column; however, every year three teams are relegated down to the Championship and three new teams are promoted. Filtering by team name would mean I would have to go and change that filter every season. Fortunately, I was able to connect to a list of current Premier League teams that was contained in one of the six tables generated by the web connector URL. I merged the Stadiums query with this list using an inner join, which returns only matching rows from both tables.
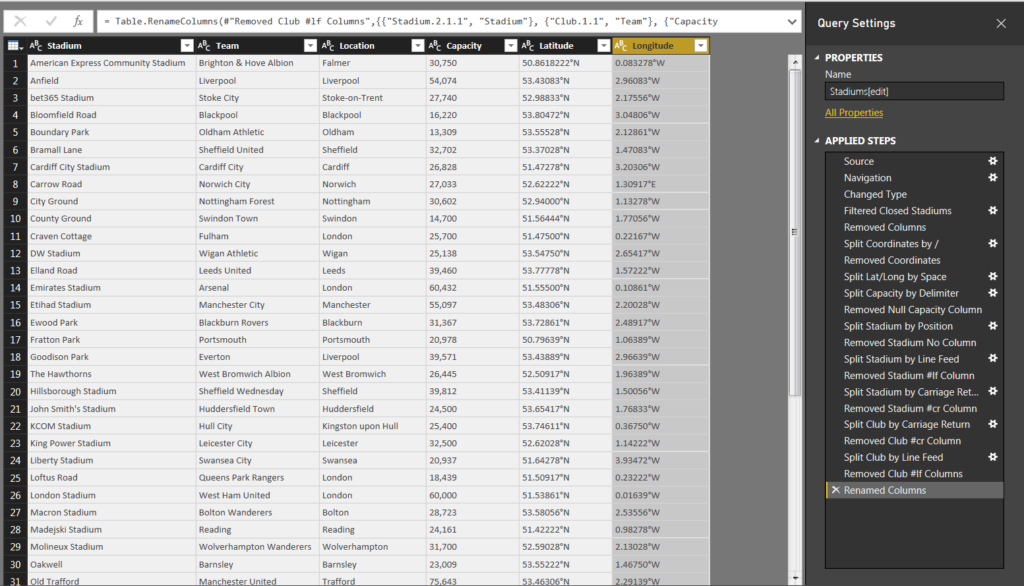
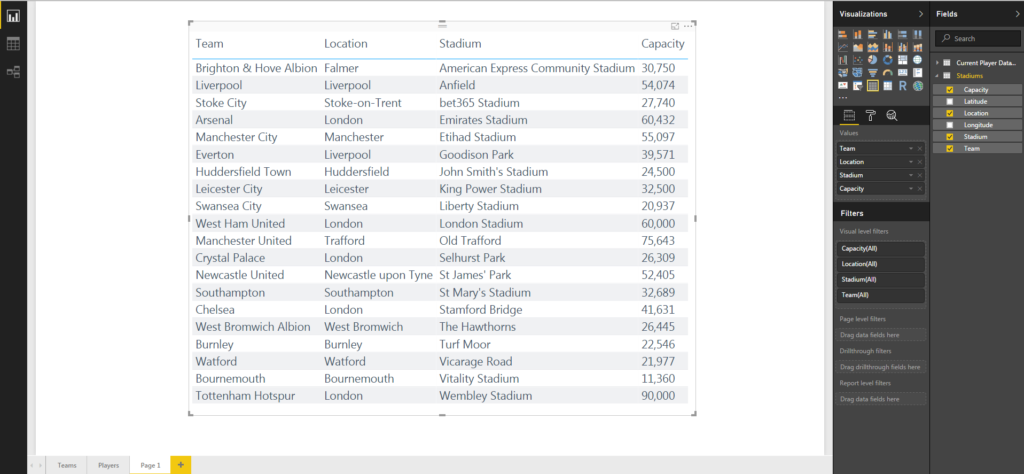
Success! My query now contained current stadiums for the current Premier League teams and would refresh with the correct data every season. I removed my merged query and was ready to load my data.

I loaded my query and double checked everything worked correctly. I dropped some of my fields in a table visual and it all looked good.
I now have the ability to plot the location of each team after connecting to this data online. I confess that have not used online data as a source that often in my reports, but I will definitely try and incorporate it more consistently to supplement my analysis and visuals.