This week I am writing about a Power Query “quick win” I recently implemented at my work place.
We consume a lot of our data through an Excel Pivot Table connection to Analysis Services multi-dimensional models. We also query SQL Server databases to get information from our CRM system.
A constant source of frustration for the team has been trying to combine the data from these two sources. I will outline our old process and how I was able to make it reproducible and take only a fraction of the time using Power Query!
Process Before Power Query (the ancient times)
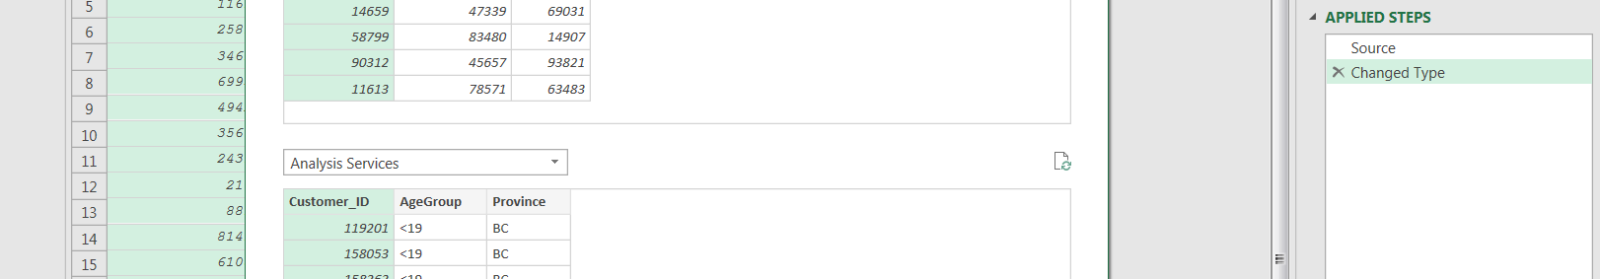
Our previous process began by querying an Analysis Services model in Excel. This brought in CustomerID, the age group of a customer, and the province where they reside. Then we would filter to return only the relevant customers to our analysis.
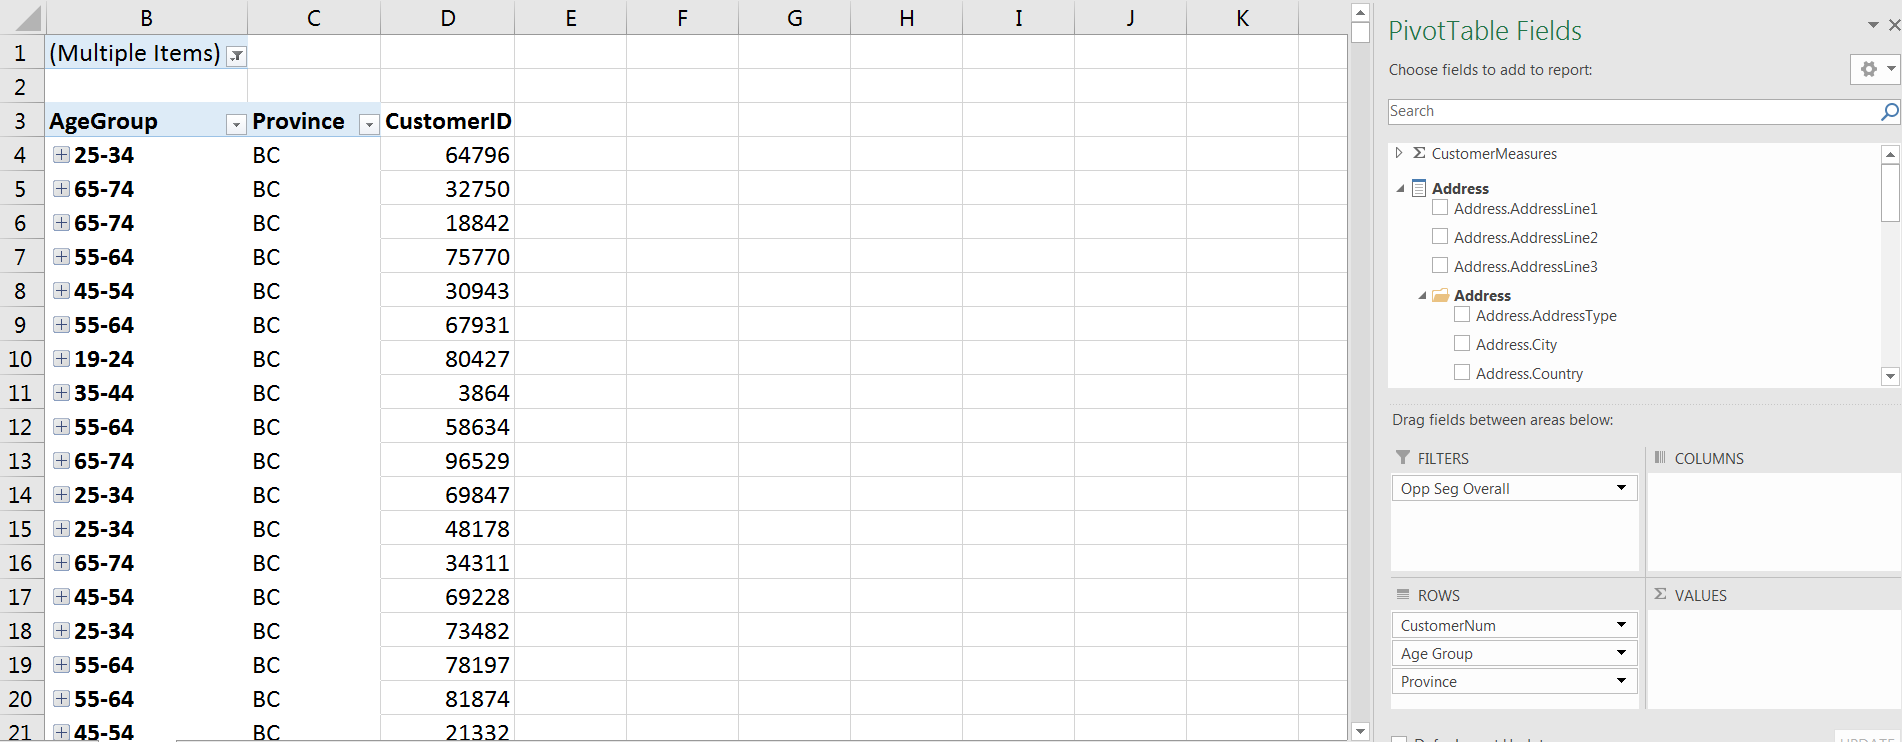
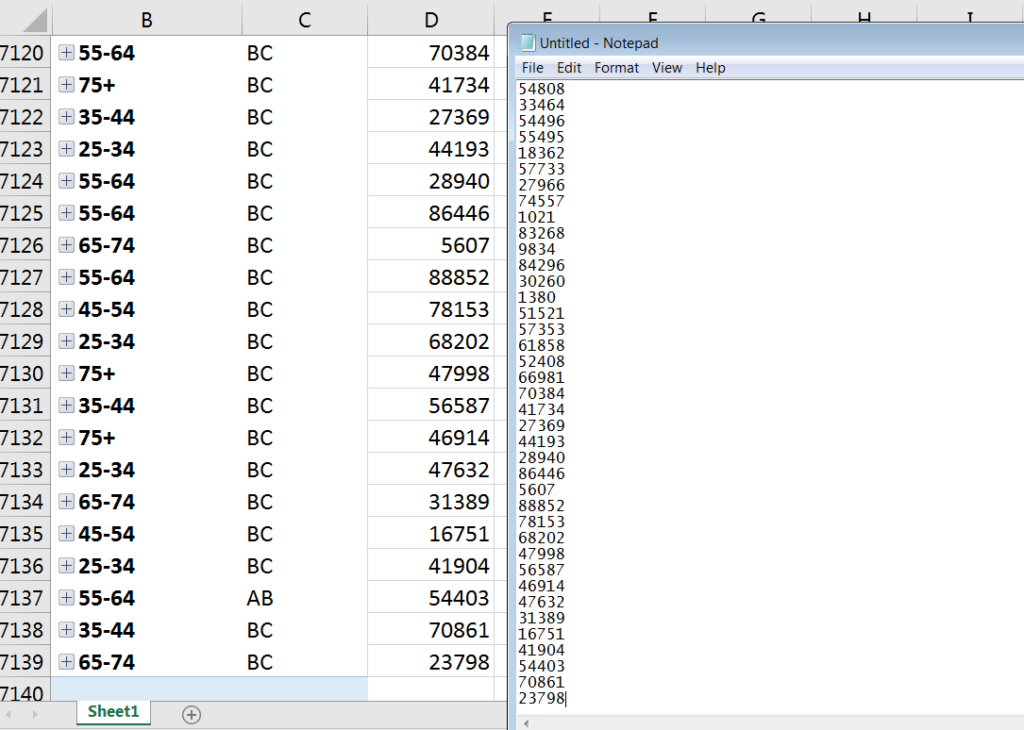
We would then have to copy and paste that list of CustomerIDs into Notepad to clear the formatting.
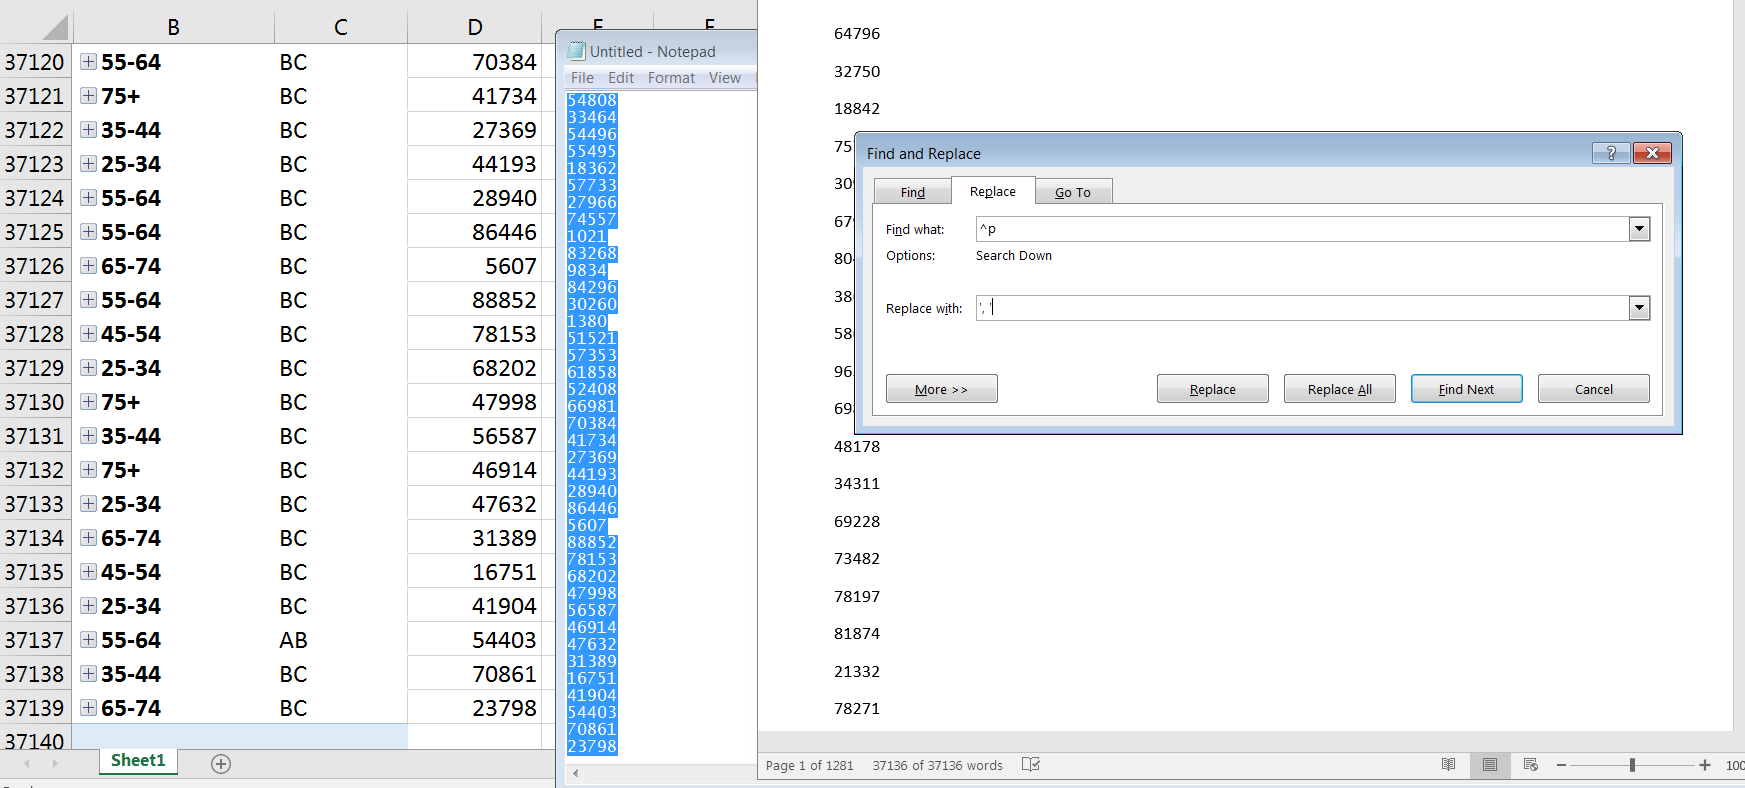
That list would then be copied into Word and manipulated to create a comma separated list. This was achieved by a Find and Replace on paragraph (denoted as ^p) with ‘, ‘ to create the comma separated list.
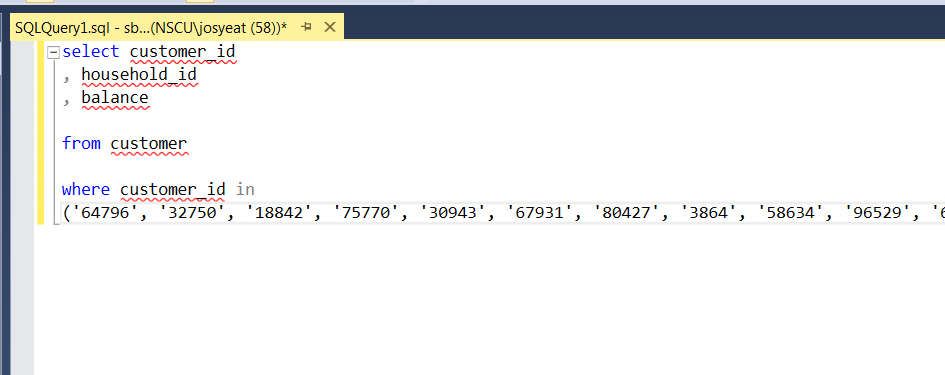
This new list was copied again (the third copy for those keeping track.. what could possibly go wrong..?) into SQL Server Management Studio. It was included in an IN Statement in our query to only return the customers that we wanted with some additional information.
The output of the query would then be copied (again) back into Excel to do some analysis.
Current Process with Power Query
Using Power Query, I was able to reduce the number of steps in the process to three without any copy and pasting. This makes our data extract and load reproducible and refreshable for future analysis.
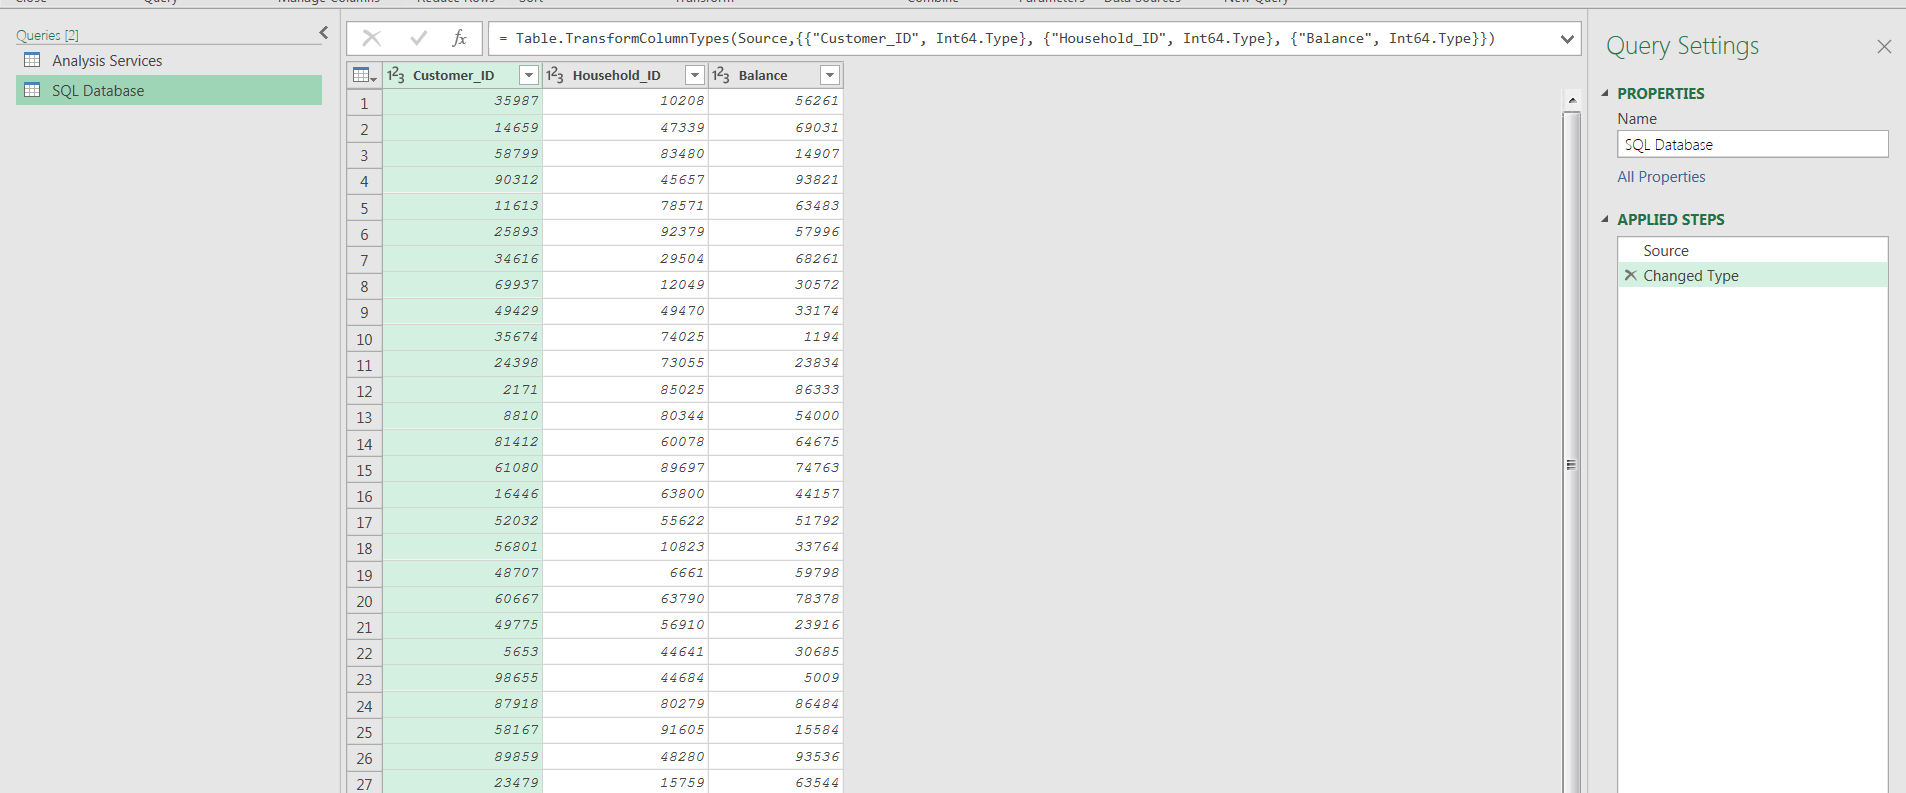
I started by creating queries pulling the relevant data from the Analysis Services model and the SQL Server database.
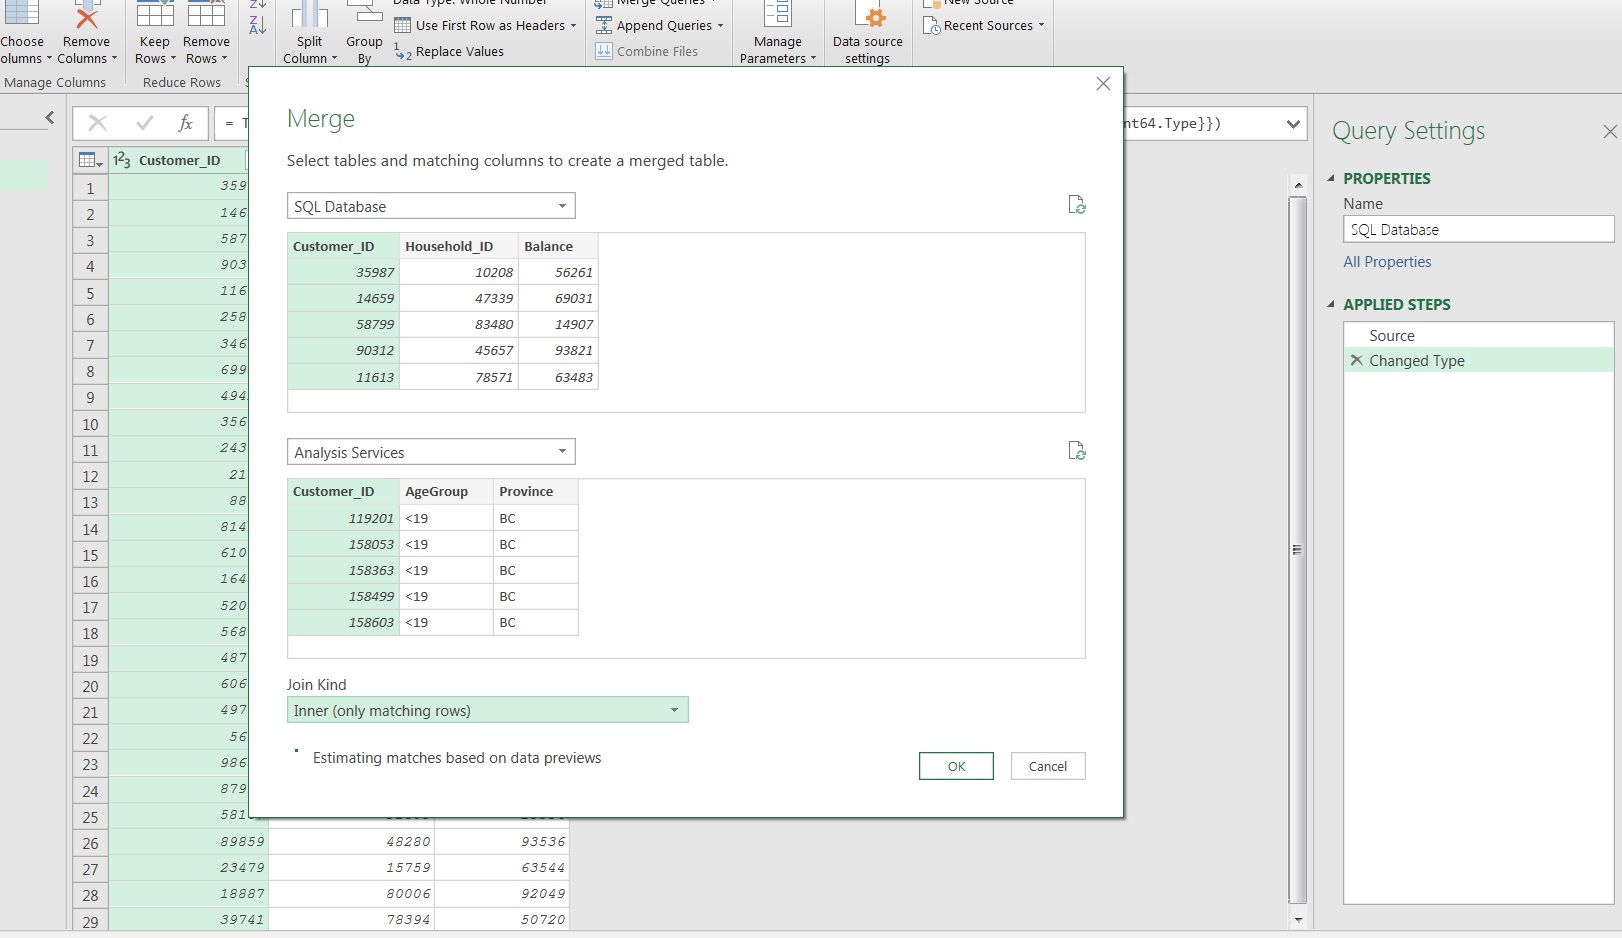
I merged the two queries with an inner join, essentially recreating the old SQL query with the IN Statement.
Then I loaded the data to the workbook.
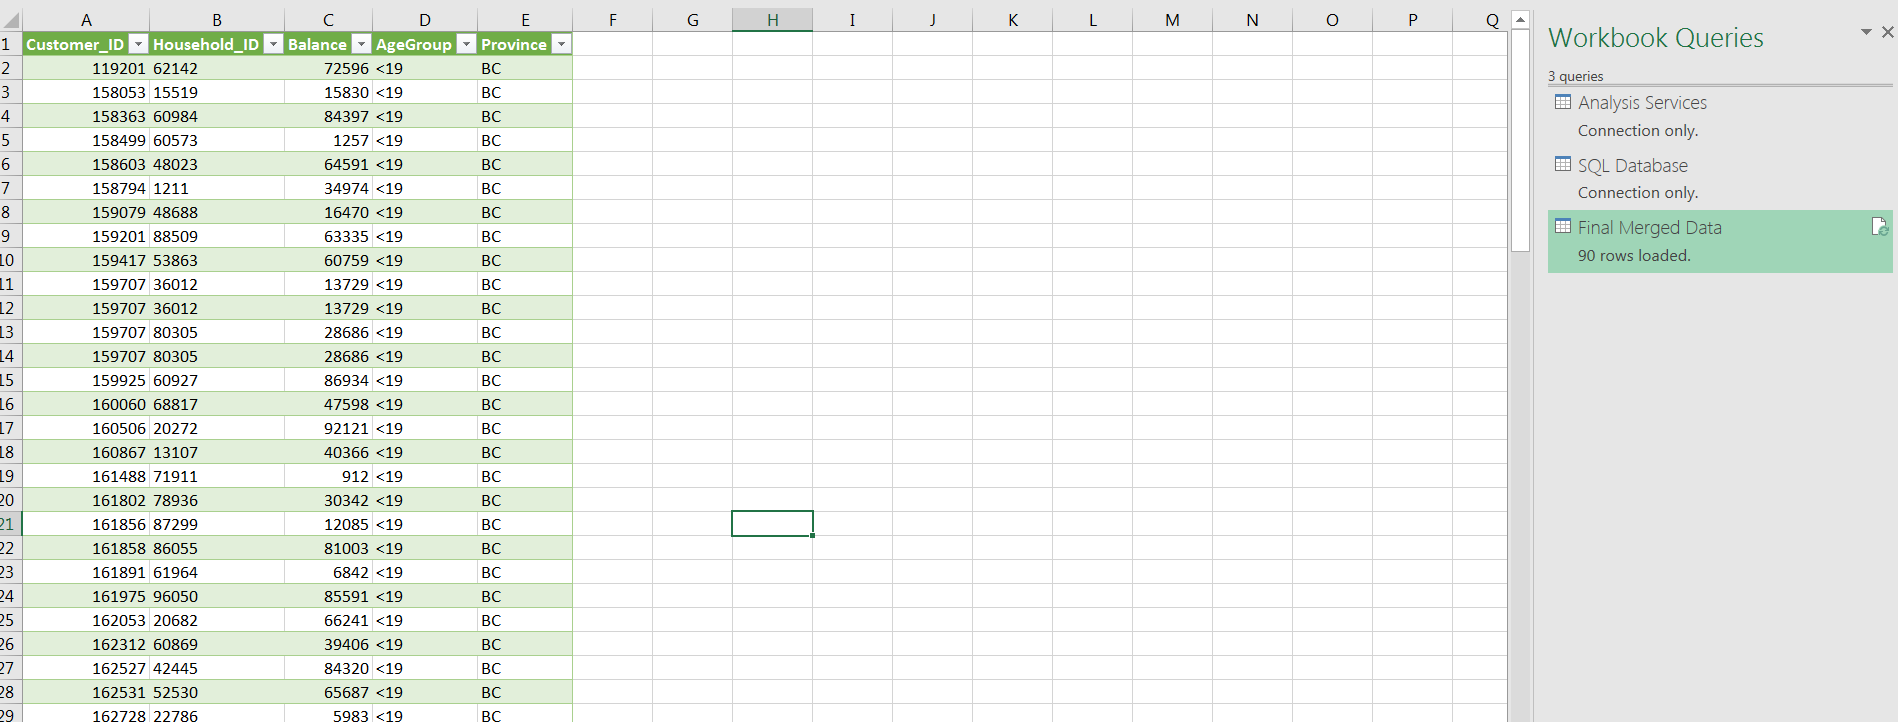
From here, we can use this table as the source for Pivot Tables, Pivot Charts, or any other types of analysis we want to do.
The best part is as the data in both data sources updates, our analysis will refresh as well. This is another example of the power of Power Query and why it is a must know for any type of analyst!