Happy New Year! I kicked off the first What’s New in Power BI at the January Vancouver Power BI User Group by presenting some of my favorite features from the December release. This month had a long list of high-impact features, so it was challenging to limit the session down to just fifteen minutes!
DirectQuery for Power BI datasets and Azure Analysis Services (preview)
This was by far the most popular feature from the update in December. It allows user to create a DirectQuery connection to a Power BI dataset published online to a Power BI workspace.
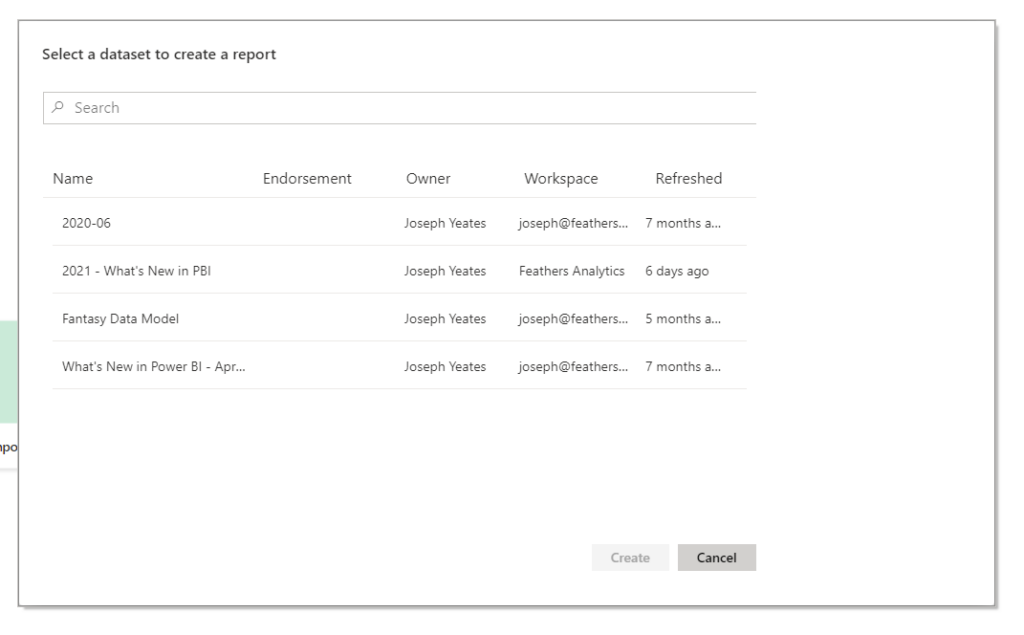
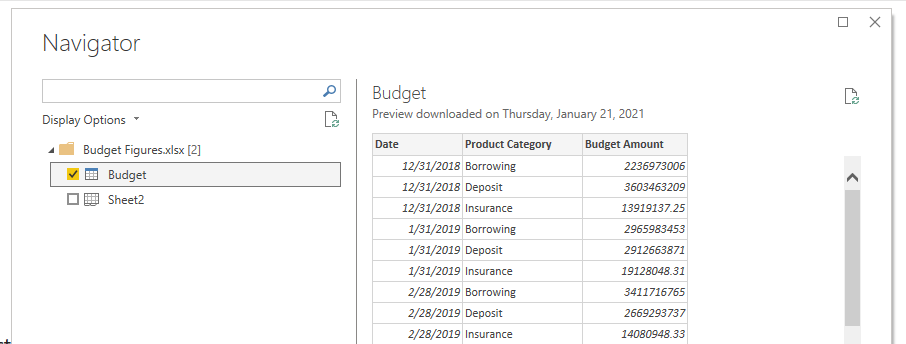
To start, I connected to the “2021 Whats New in PBI” dataset in my Feathers Analytics workspace.
This created a Live Connection to the dataset within the report. This is denoted in the bottom right corner within Power BI Desktop. There is a new option available to “Make changes to this model”.

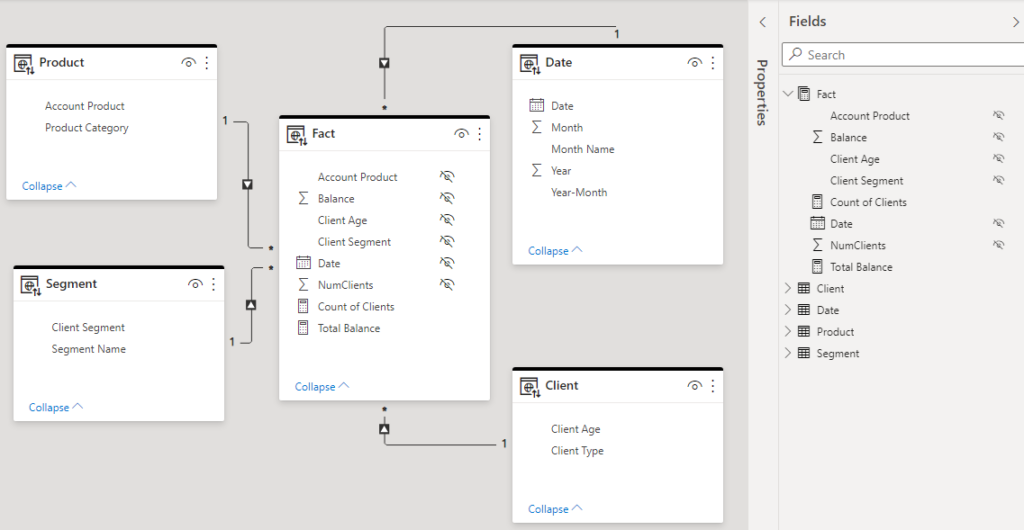
I navigated to the model view to take a look at the model I had connected to. None of the queries were loaded into the Power Query editor, as they had not been imported.
In order to make any changes to the data model, including adding an additional query, I had to change from a Live Connection to a DirectQuery connection. This brings up the following warning pane.
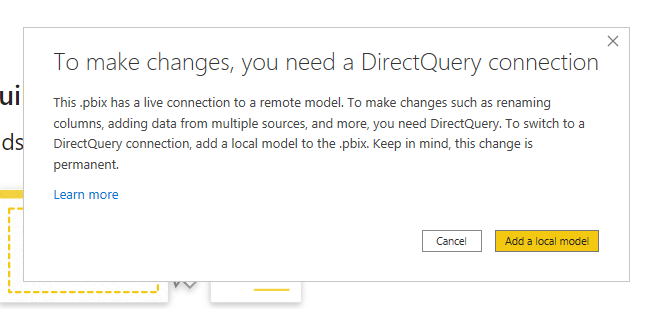
I selected “Add a local model”, which switched the storage mode to DirectQuery. Again, this is denoted in the bottom right corner of the report.
Now, I was able to add an additional query to the data model that pulls from a source outside of my published Power BI dataset. I created a connection in the Power Query editor to a table in an Excel Workbook.
Once I loaded this query to the report, the storage mode changed once again to Mixed. This is because I had both a DirectQuery connection, to the Power BI dataset, and an import connection, to the Excel Workbook.
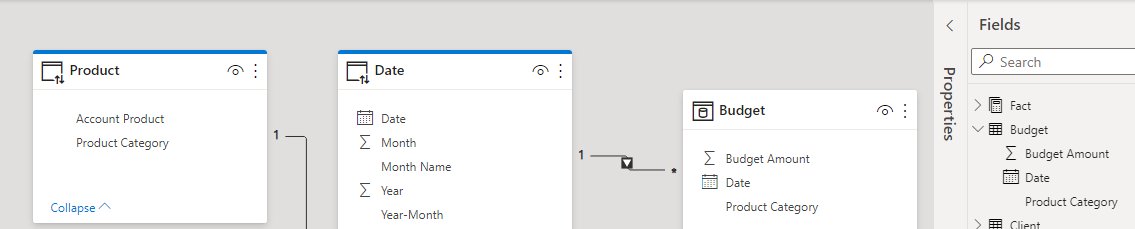
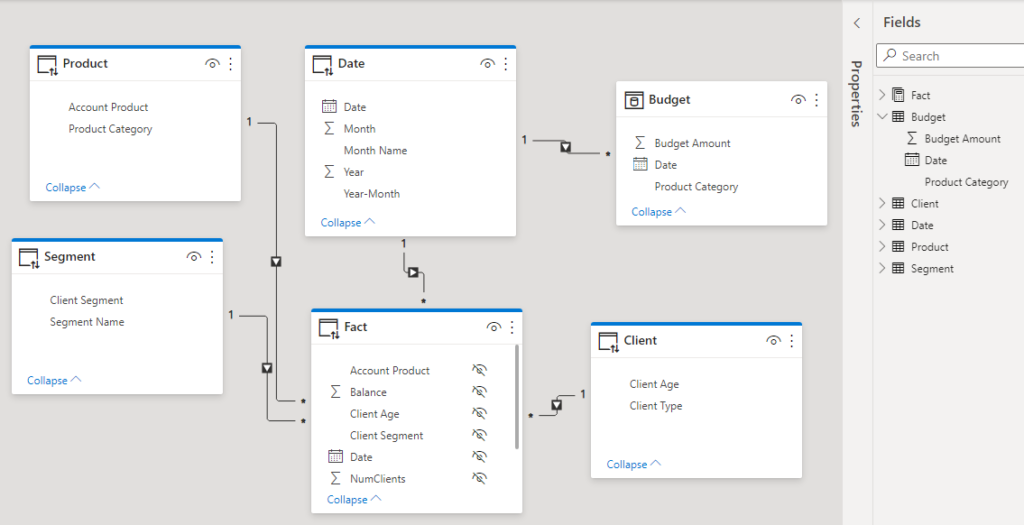
This is how it looks in the Model view within Power BI. The four queries from the Power BI dataset are shown with a blue band across the top and the DirectQuery icon in the top left corner on each of the tables. The “Budget” query has the import icon in the top left corner of the table. Even with these tables coming from different sources, I am able to create visuals in the report based on data coming from both places!
This has been one of the most requested features in Power BI since I started using the tool in 2016! And it has finally arrived!
Small multiples allow a user to create the same visual for each distinct value of a category. In the example below, I start with a clustered column chart plotting sales and budget amount over time.
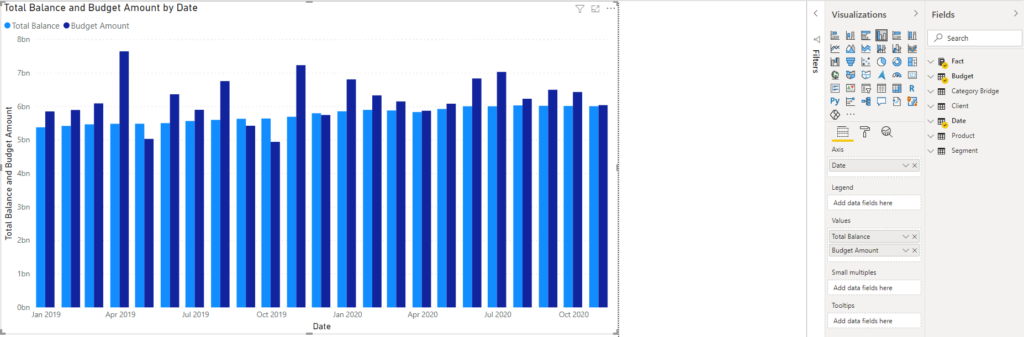
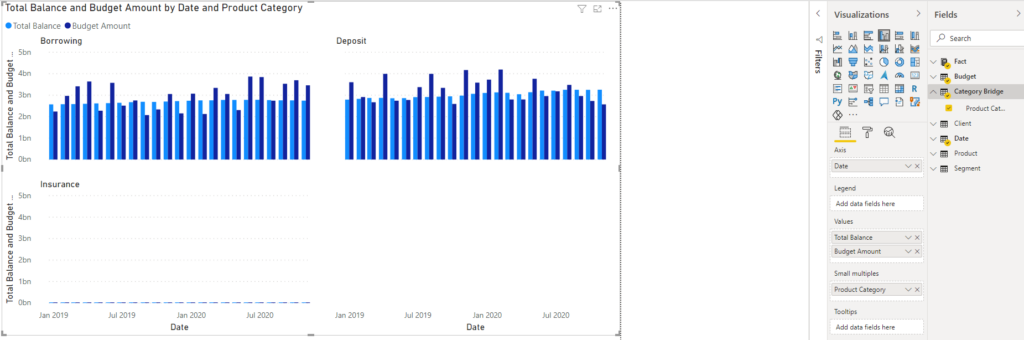
To break this visual down by product category, we can now drop the category field into the Small multiples area in the visualizations pane.
Now I have a unique clustered column chart for the three different category values: Borrowing, Deposit and Insurance.
Recent changes to Power Query and Dataflows
My final favorite update from this month was a whole host of updates to Power Query and Dataflows! I highlight a few of my favorite below, but for the full list of feature updates to Power Query check out this blog post.
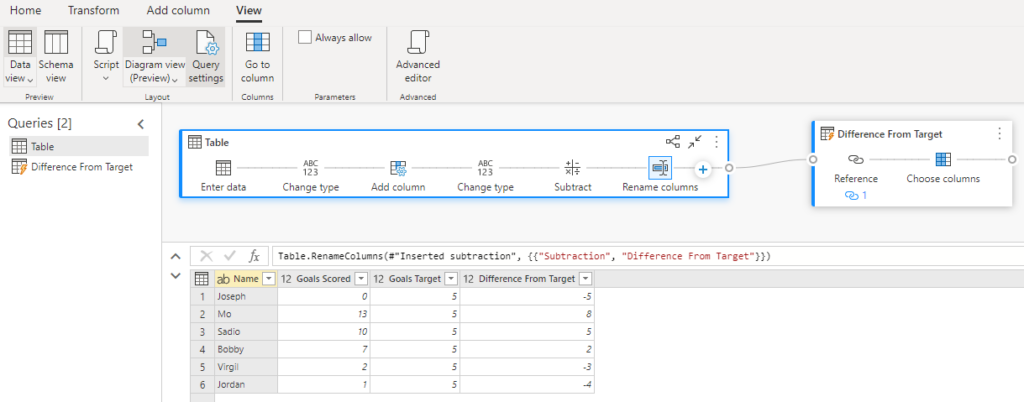
The first is the new Diagram View in Power Query online. This provides a visual representation of the applied steps of a query or sequence of queries. Now we are able to see the data lineage visually of our final query in a data model.
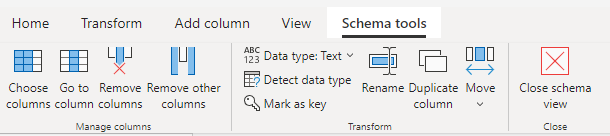
The second is another new view in Power Query online: the Schema View. This shows some of the key attributes of a query such as the column names, the data type and if it is a primary or foreign key.
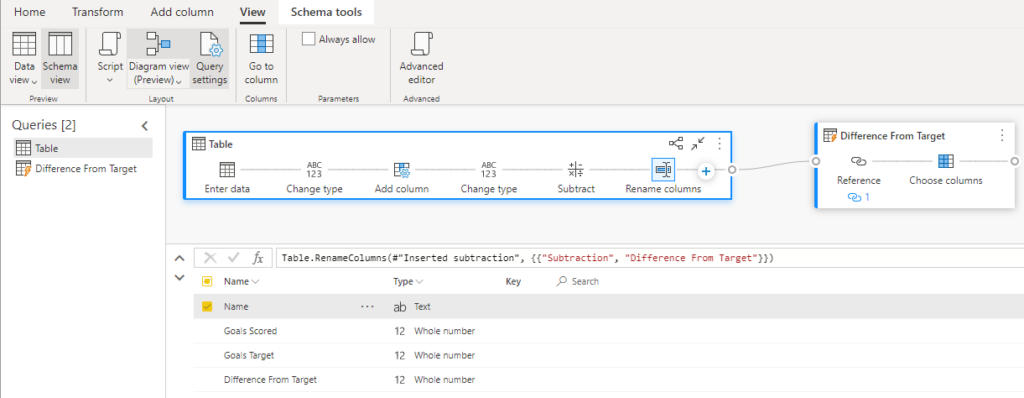
To switch to the Schema view, navigate to the View tab of the ribbon and change from Data view, a preview of the applied steps, to the Schema view by clicking on the schema view icon. The Schema tools tab is now available on the ribbon.
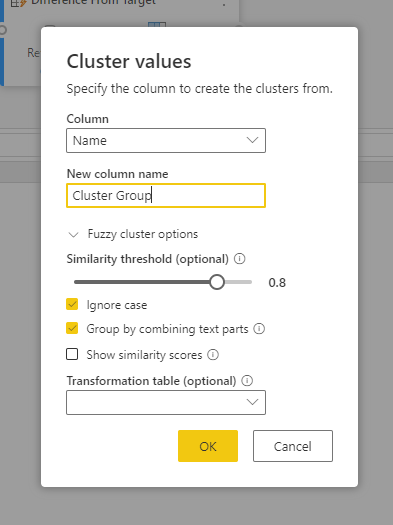
The last update to Power Query is the ability to create a generic or clean name of similar values by clustering the values in a column. For example, rather than cleaning up a column of names to correct misspellings or group together different spellings of the same name, we can create a new column that clusters these names together automatically.
This is done by navigated to the Add column tab on the ribbon and selecting the Cluster values icon.
Those were my favorite features from the packed month of December! I chose an update to three distinct areas of Power BI: data transformation, data modeling and data visualization. As always, I am looking forward to next month!