
I presented this content, as well as my favorite updates from the November release, at the Vancouver Power BI User Group. My favorite features from this month include updates to the look and feel of the Desktop app and further enhancements to the Q&A visual.
Canvas watermarks
This feature will be helpful for new users of Power BI. When opening the Desktop application, there are now helpful prompts on the report canvas and within each of the different report areas.
I like the initial watermark as it clearly instructs that data is the first step! There are also quick buttons to import data from common data sources, such as Excel, SQL Server and a pasted data table.
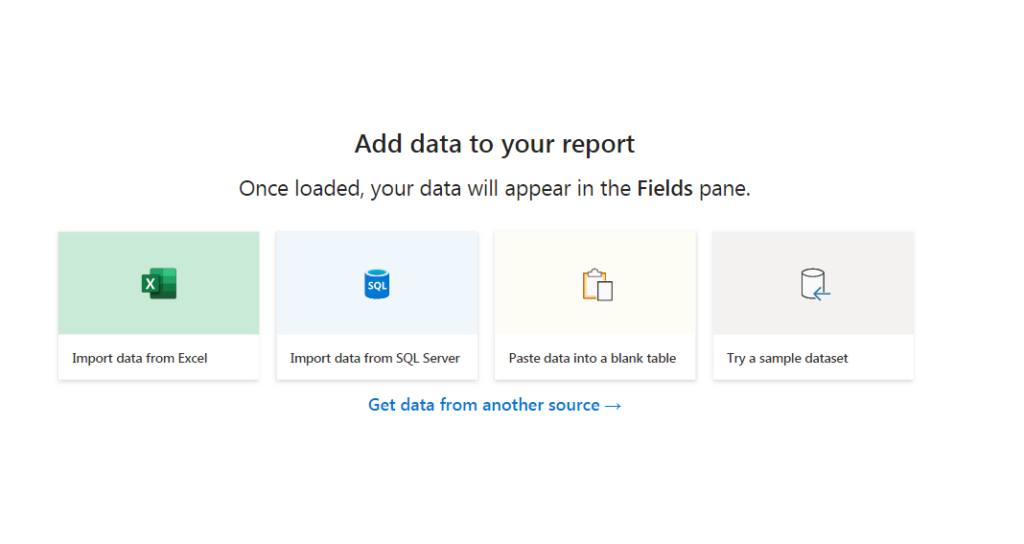
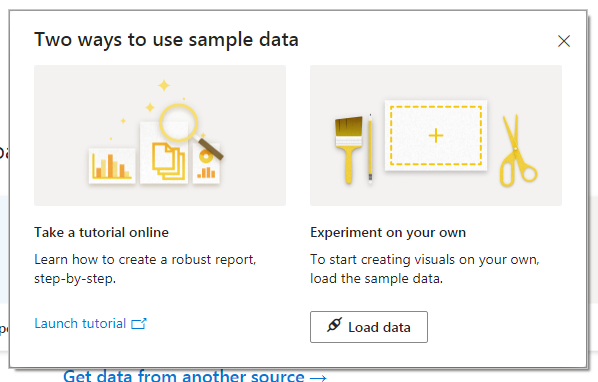
A huge improvement as part of this feature is the new sample data set! I love that users can start learning the tool without needing to worry about acquiring a data set. It is easy to connect to: simply select the “Try a sample dataset”. This is downloaded when installing the application.
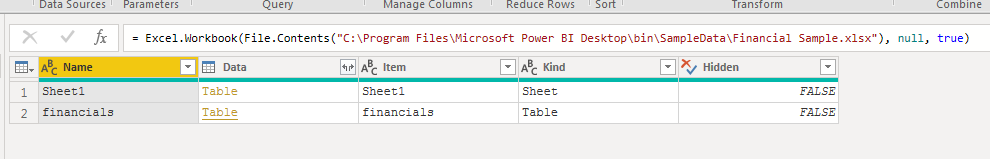
In the Power Query Editor, it connects to an Excel file called Financial Sample. It is a small data set with a few different features to start building visuals.
Once the data has been loaded there are prompts to start building visuals:
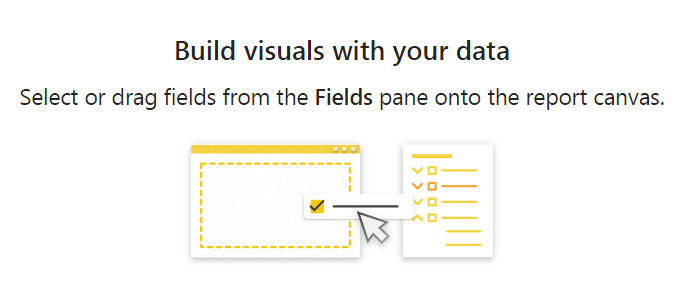
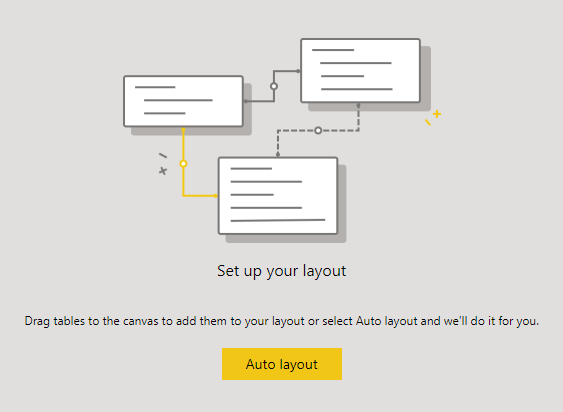
As well as creating a data model:
Export data from Q&A visual
Another month and yet another update to the Q&A visual! This AI visual has been updated almost every month in 2020! It is one of my favorite features and updates to showcase What’s New in Power BI for a given month.
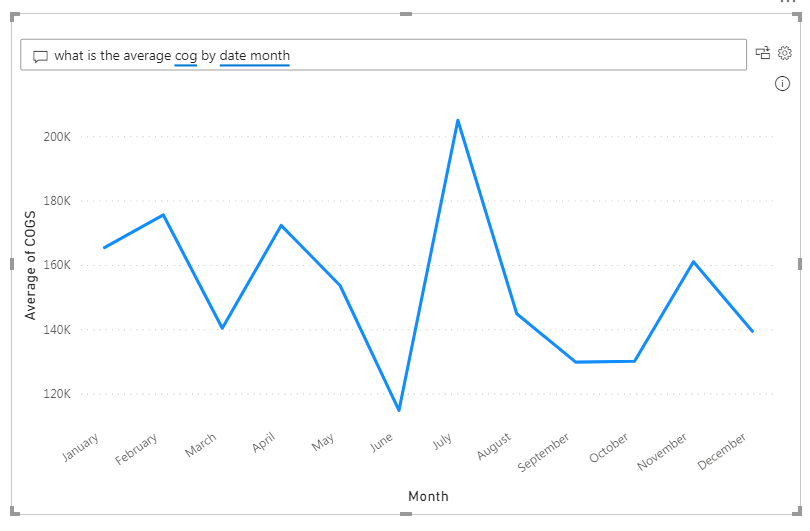
This month, there is now the ability to export data from a visual creating from natural language query! For example, if the user creates a line chart by asking the question: “What is the average cost of goods sold by month” we can now export the underlying data of the visual in a .csv file.
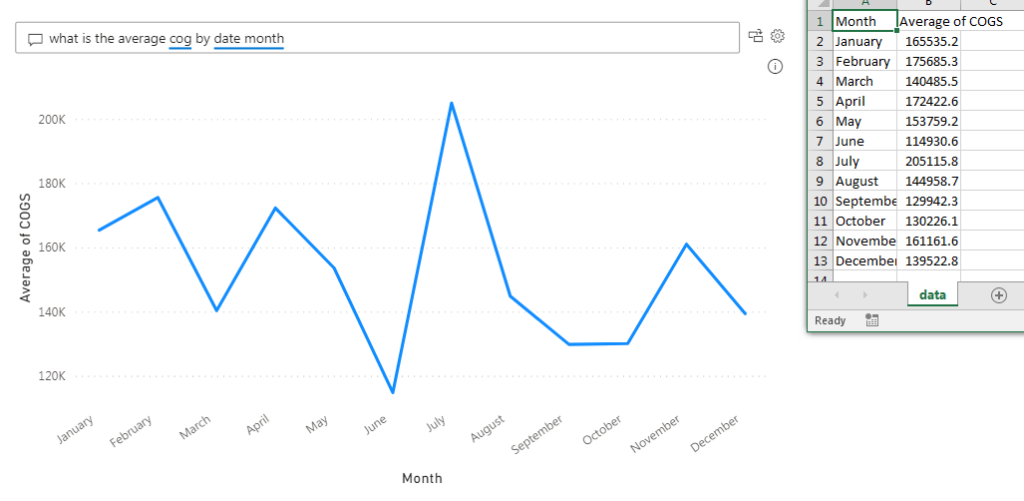
To achieve this, navigate to the ellipsis in top right hand of Q&A visual. Select export data from the drop down. There is now a data.csv file in the download folder. When I opened this up, I had a table of data containing the month in one column and the average COGS in the second column.
This aligns the Q&A visual with other report visuals in Power BI. I love that this visual is becoming more integrated in Power BI and feels core to the report authoring experience.
Those are my two favorite updates from the October 2020 Power BI release! I always eagerly await the next update in anticipation and enjoy presenting my favorite new features and updates at the Power BI user group! Stay tuned for next month!