I’m a little late to the party this month, but the April update had some fantastic features.
The two features I’ll be highlighting this month are the enhanced button functionality and the Q&A explorer. They can be used together to create a powerful user experience. These features provide the ability to ask questions of the data not contained in report visuals.
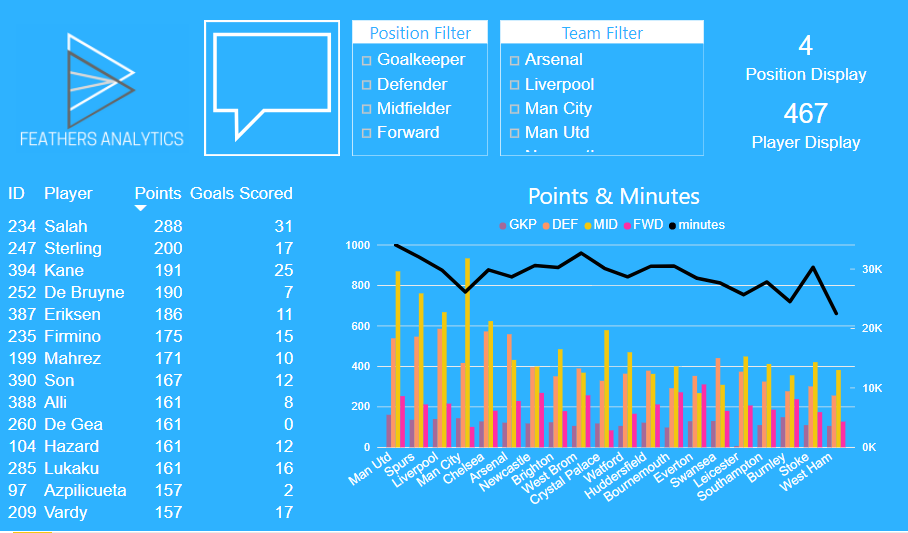
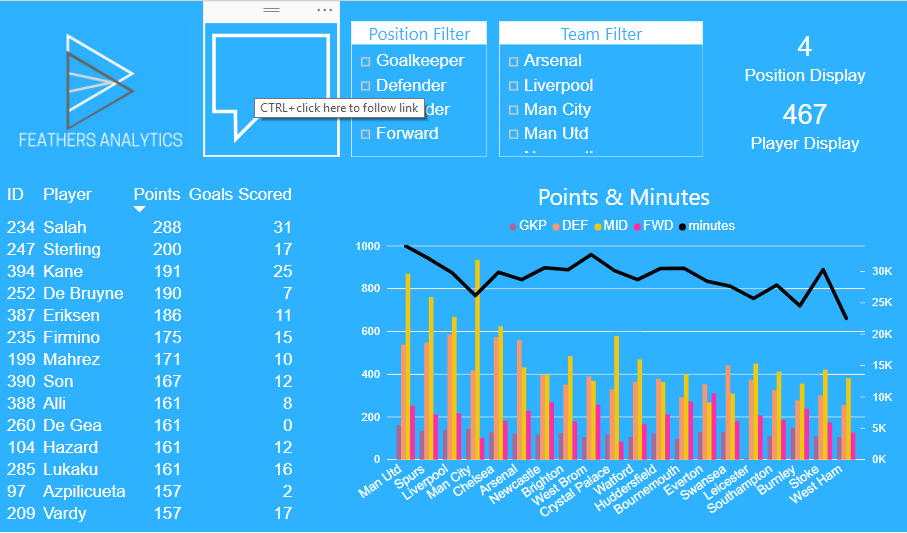
I’ll use the same Premier League Fantasy Football report from last week that I used to demonstrate a DAX display measure.
Buttons
There is a new buttons icon in the Insert section of the Home tab on the ribbon. This provides a drop down list with many options of buttons to create.
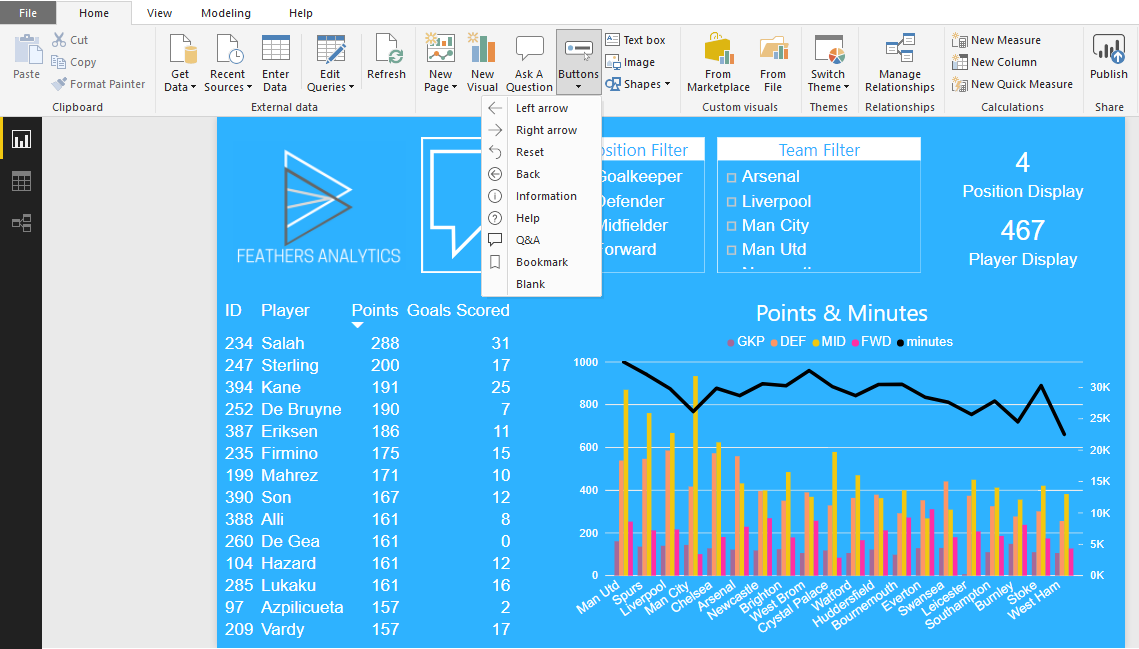
I selected Q&A which created another Q&A button in the top left of the report.
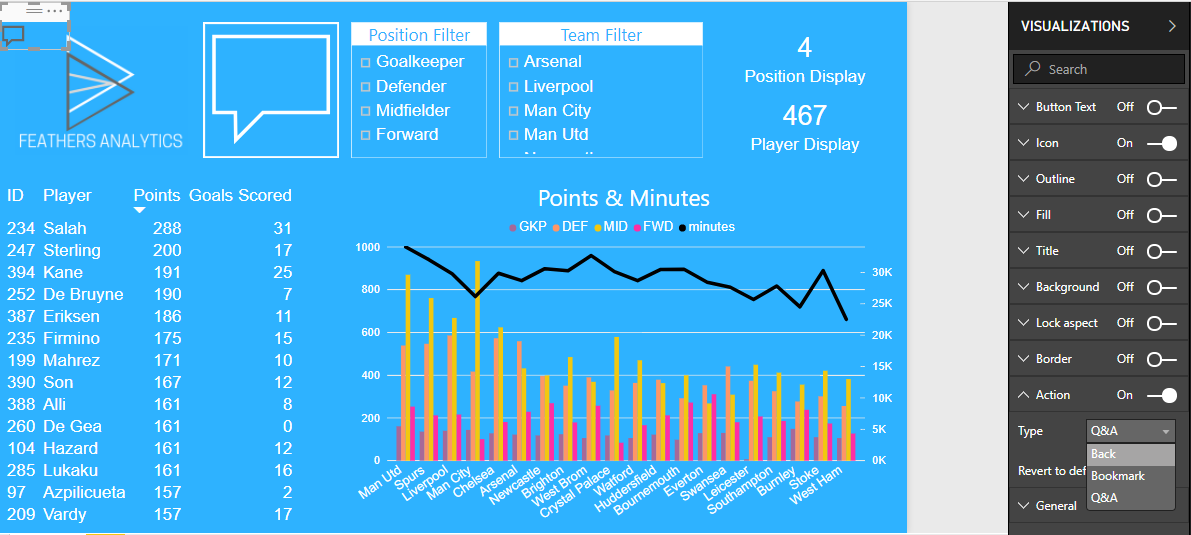
There are lots of formatting options for the button. An important change was setting the Action Type of the button to Q&A.
Q&A Explorer
I used the button I created to open the Q&A explorer. Since I was in edit view, I control clicked the button to follow link. In read mode, you can just click on the button.
This brings up the Q&A pane where you can:
Ask a question about your data
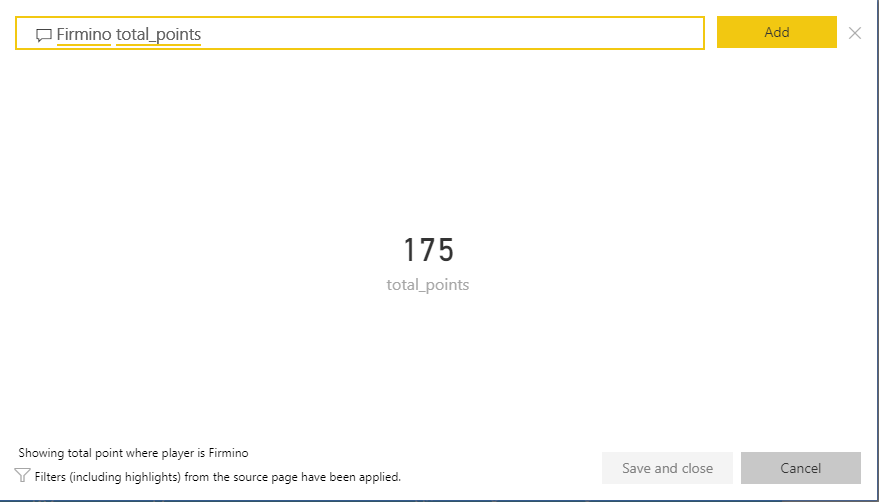
An example of a question could be: how many points has a player scored this season? I was interested to see how many points Bobby Firmino had scored.
All I had to do was type Firmino and total_points. This filtered the data to only include players with name of Firmino and display the total_points.
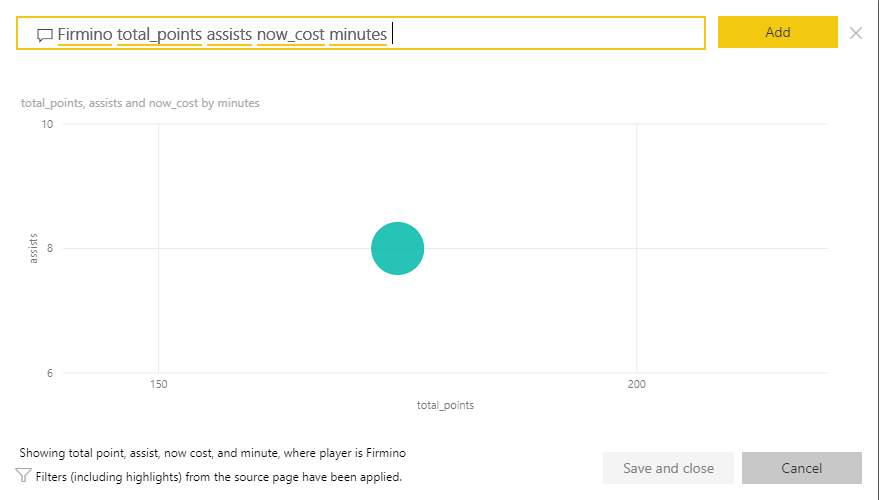
Depending on how many fields you add to your question, the visual will change.
I added three more categories to my question, which returned a Scatter plot.
I have to admit, I did try to break the Q&A by adding lots of fields. After a certain point it eventually returned a table.
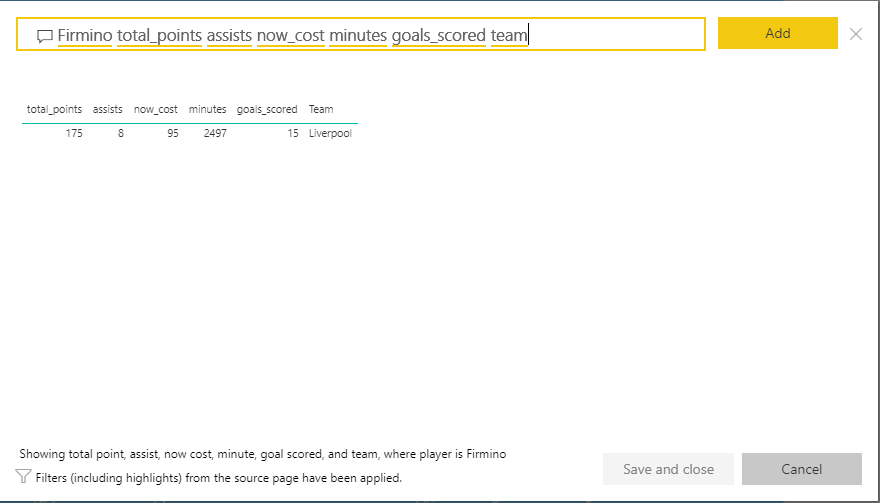
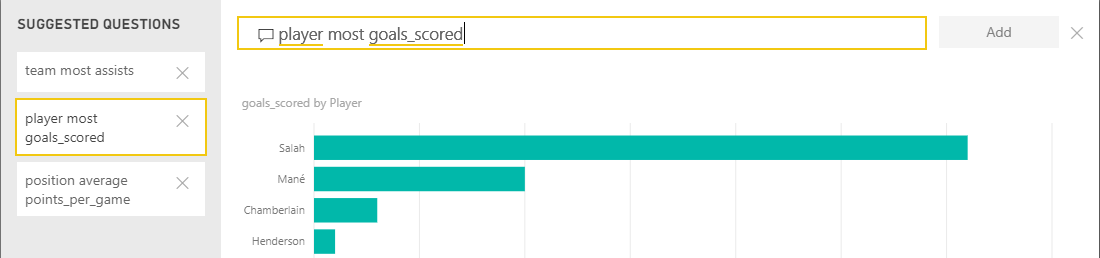
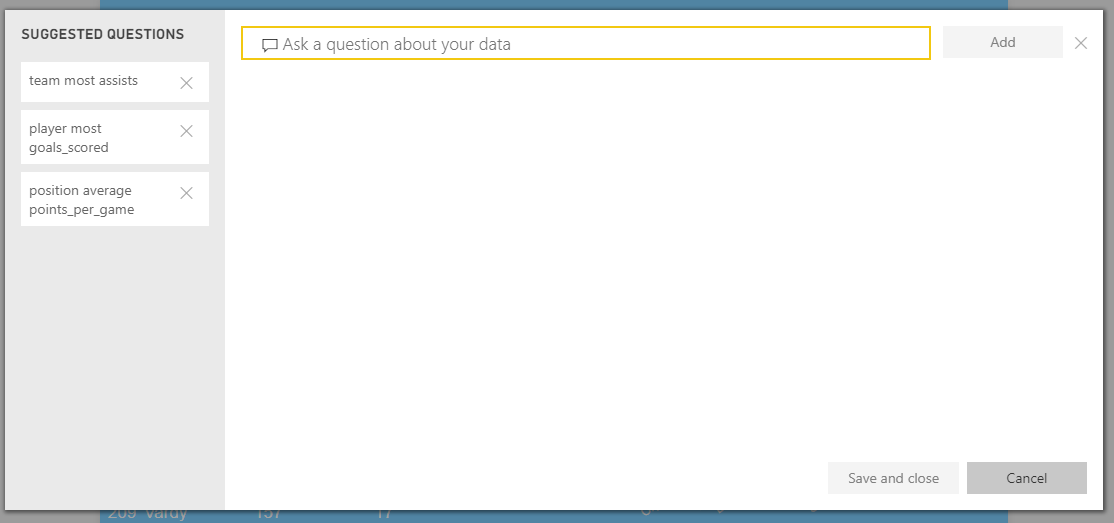
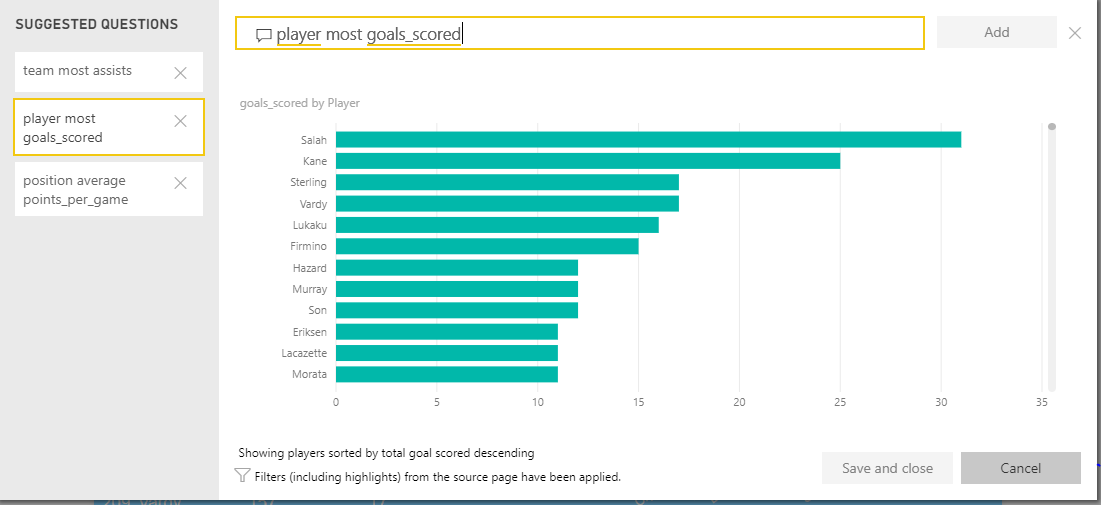
The Q&A Explorer also gives you the ability to save these insights or questions for a user to navigate. I created three insights and clicked the Add button in the top right.
This saves the insight under the Suggested Questions pane on the left. One of the saved insights was “player most goals_scored”. Not the best name.. But it visualizes the goals scored by players in descending order.
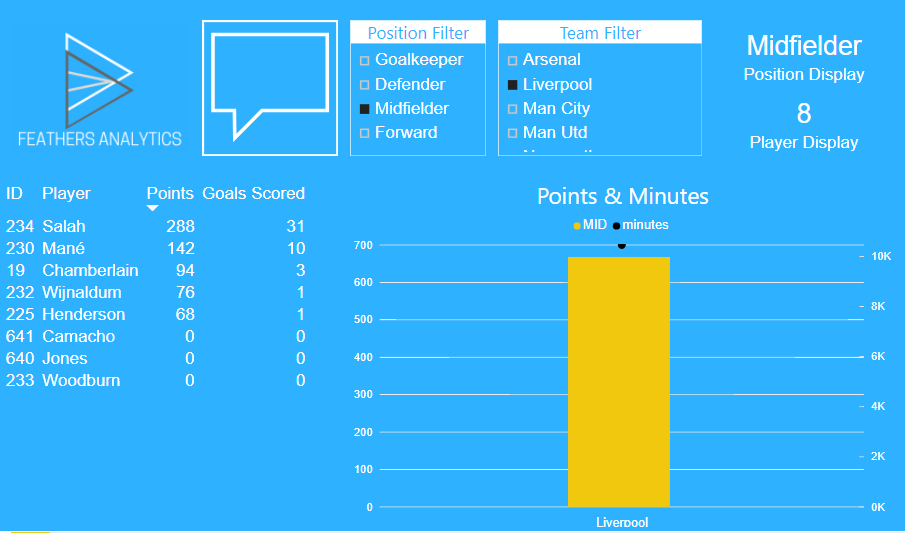
One important point of note is that the Q&A pane maintains the filtered context of the report, including highlights.
For example, I filtered the report the only return midfielders who play for Liverpool (mostly so I could highlight Mo Salah’s incredible season).
When I go back to the same “player most goals_scored” insight, only Liverpool midfielders are returned in the visual.
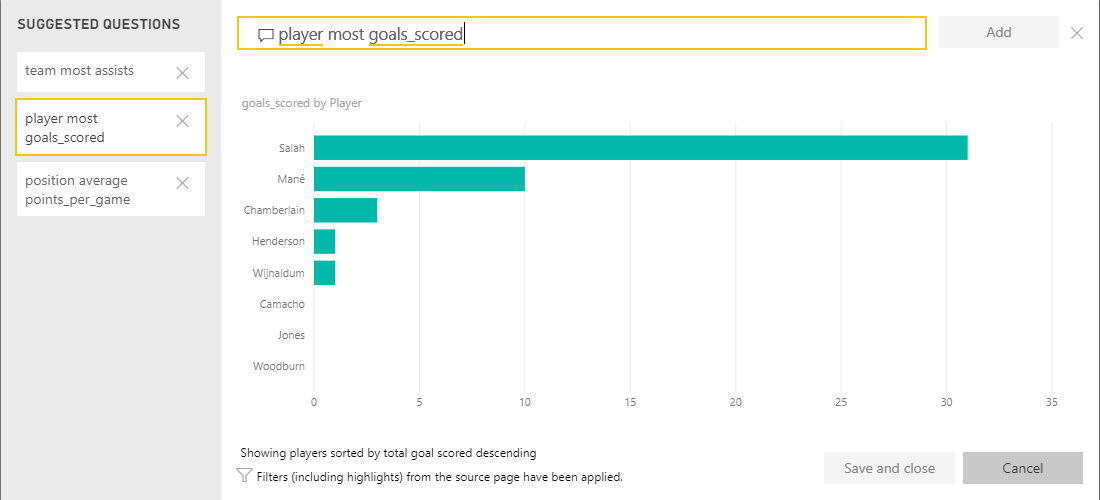
Combining the Q&A Explorer with the new buttons gives more control over asking questions ad hoc questions in a report. This was another great month of features and I can’t wait until May!