Another quick blog post today! I built a Power BI report over the long weekend using data from the Community Shield game on Sunday. I will use this report to demo some of the new features in Power BI next week.
This post will show how I built the time dimension for my report. The methodology is similar to building a date dimension. I hadn’t had the opportunity to play around with time data before, so it was fun trying some new buttons in the Power Query Editor!
To build the dimension, I wanted to use the List.Times() function. This function requires three arguments:
- The beginning time for the dimension
- The number of increments added to the beginning time in the dimension
- The size of the increments
I wanted my dimension to start at the kick-off time for the game, 7.00am PST. I wanted my dimension to span two hours and have a row for every second in the two hours.
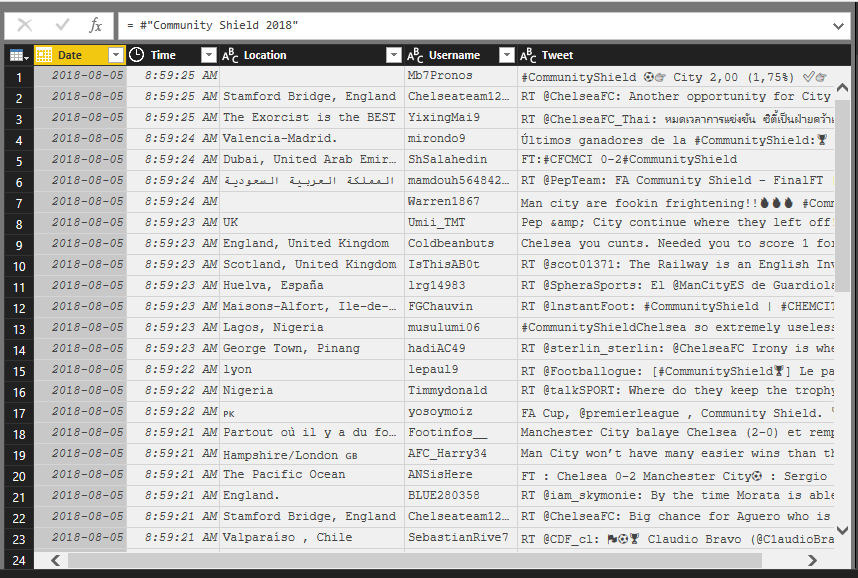
To generate the data for the function, my first step was to reference some of the other data in my report.
It wasn’t strictly necessary to do this as the data isn’t going to change and thus the values can be hard-coded. However, I wanted to showcase how a time dimension can be generated dynamically.
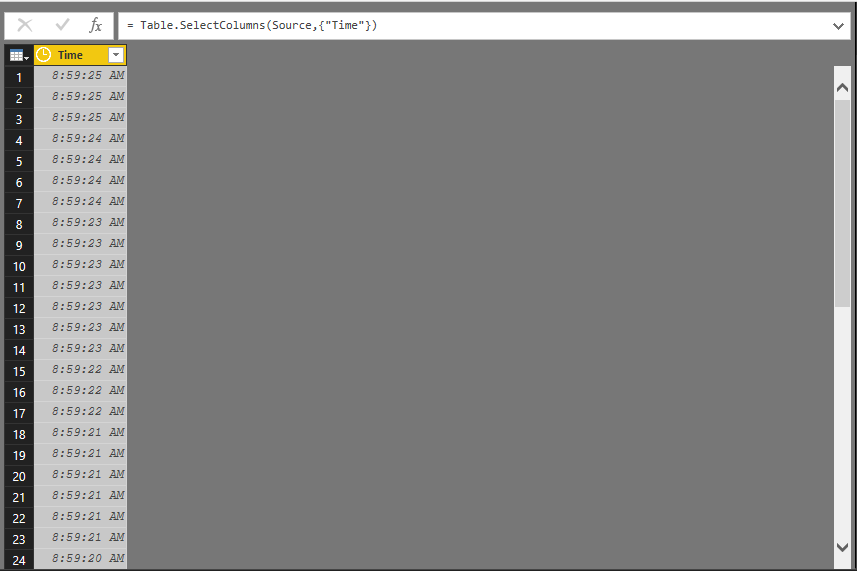
My next step was to remove all other columns except for the column containing my time data.
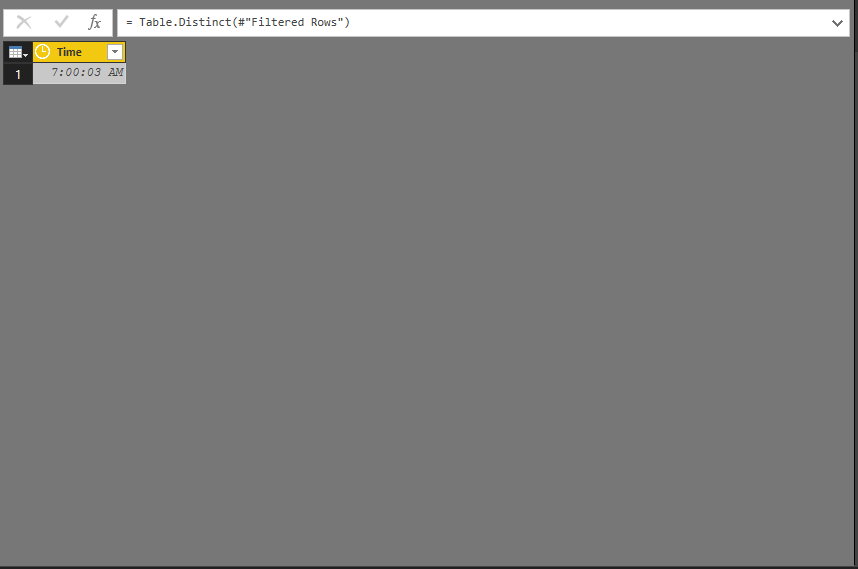
At this point I filtered for the earliest time and removed duplicates. The process is exactly the same for generating the end time (which I will need to calculate the duration argument).
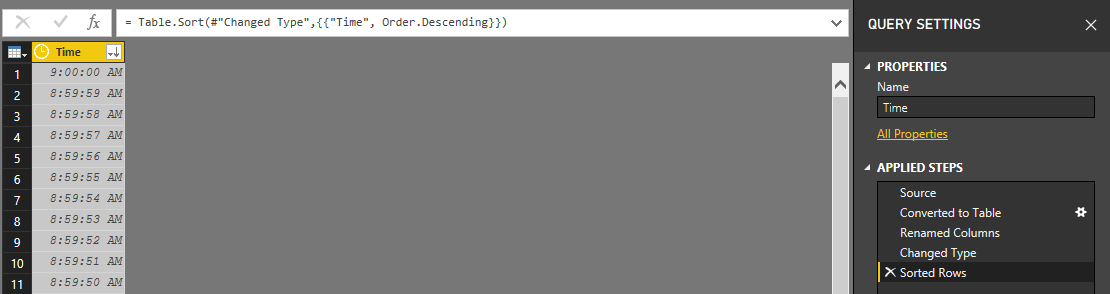
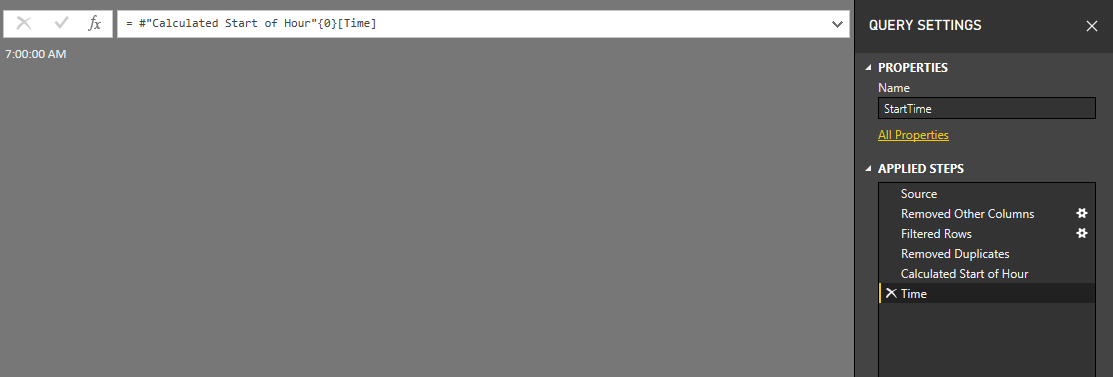
From here I calculated the beginning of the hour and drilled down into the value. This gave me my start time. I repeated this process to calculate the end time for my dimension.
The next step was to calculate the duration between the start and end times.
I created a blank query and entered the formula:
= EndTime - StartTime
This gave the result of 1.59.59.99, or one hour, 59 minutes and 59.99 seconds.
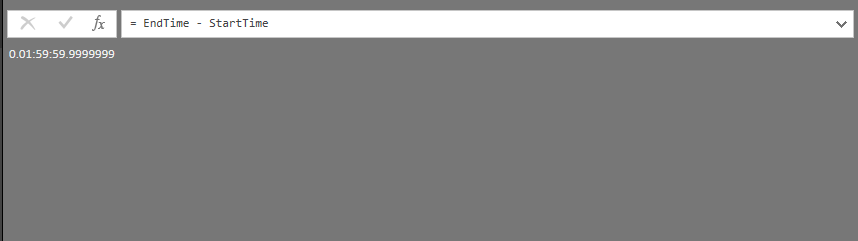
Power Query recognized I was calculating the difference between two times and returned the difference as a duration of time. However, I need the duration to be the total number of seconds between the two times.
This was made easy through the interface! I selected Total Seconds from the Duration button on the ribbon.
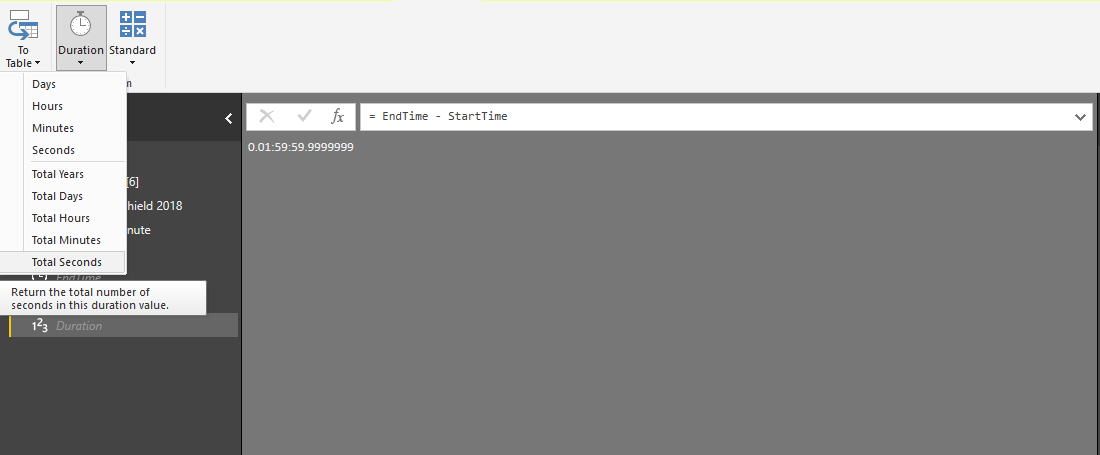
This returned 7199.99 seconds. Almost exactly what I was looking for.
I cleaned up the value by rounding up to the nearest whole number.
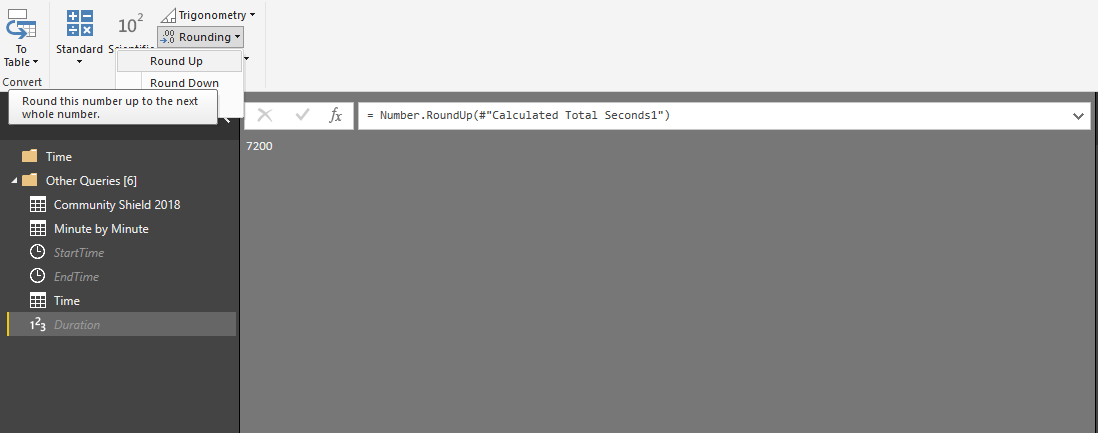
This gave me the duration in seconds and I now had all the data I needed to calculate my time dimension.
I created a new blank query for the List.Times() function. The first argument was the StartTime that I generated dynamically.
The second argument was the Duration value I had calculated, plus one.
The third argument I created using #duration(0,0,0,1) which corresponds to one second. The three proceeding zeroes correspond to day, hour and minute.
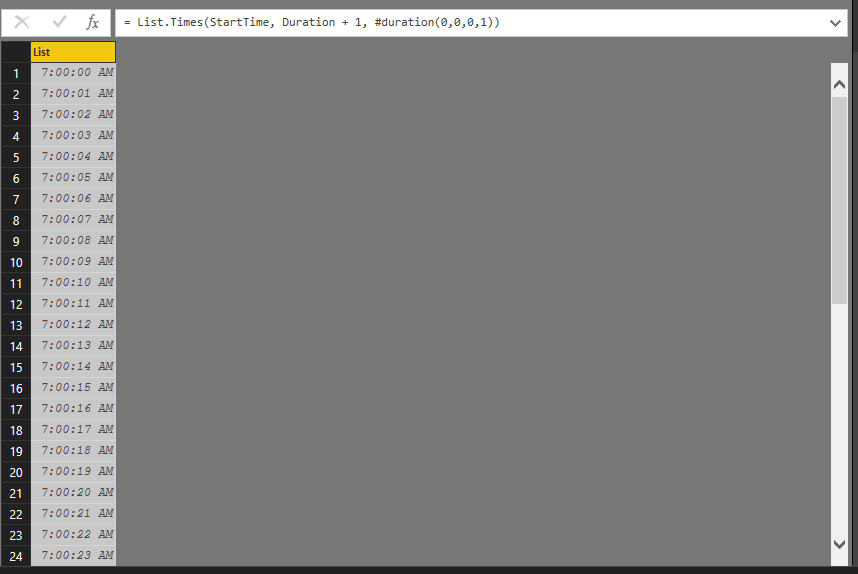
Now I had a list of all times between 7.00am and 9.00am, increasing by one second.
My next post will demonstrate how I used this dimension in my report! I will also showcase some of the new features in Power BI from the past two months!
1 thought on “Power BI – Time Dimension”
Comments are closed.