For the second week in a row, a Power BI Update post! A short review of my two favorite features from this month: enhanced data view capabilities and radius control for the Donut chart visual.
I used the same report from my May 2018 Update review, which analyzes the teams participating in the 2018 World Cup and the countries who bid to host the tournament.
Filtering & Sorting in Data View
My favorite update to data modeling this month is the ability to filter and sort data in the data view in Power BI.
I navigated to the Data View, found on the side pane to the left of the report canvas.
I selected one of my queries: World Cup bidders.
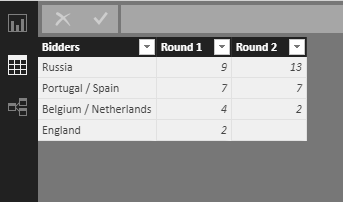
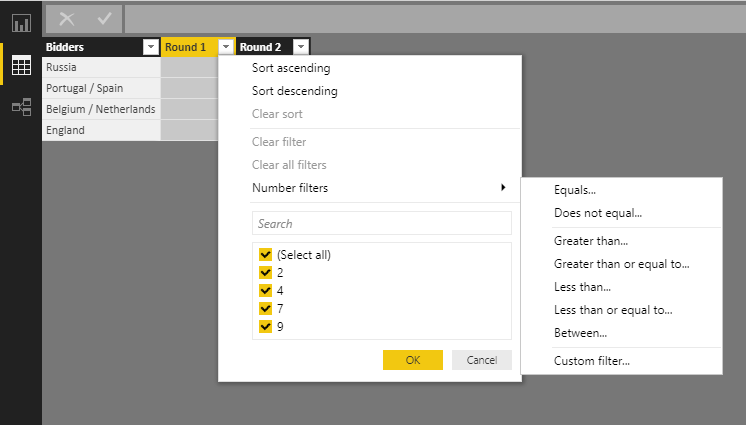
There is now the ability to select the drop down menu from the columns in the table, similar to the experience in the Power Query Editor.
The data can now be sorted and filtered without having to open the Editor.
Donut Radius Control
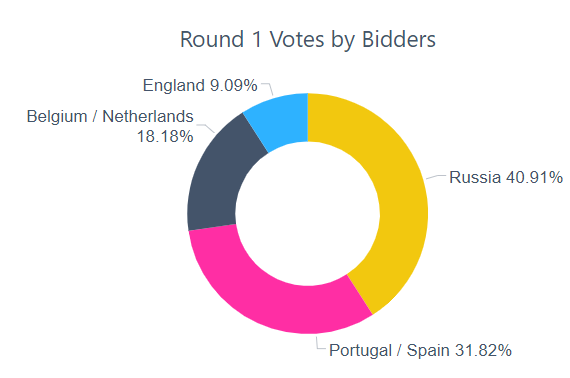
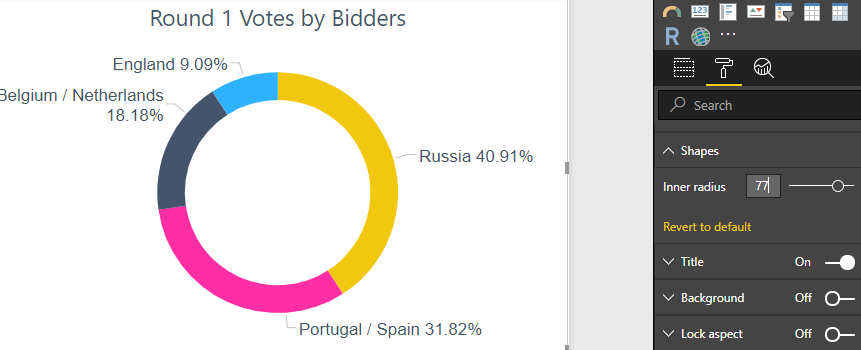
This feature provides more control over the donut visual. I started with a donut chart visualizing the first round of votes for countries bidding to host the 2018 World Cup.
To change the radius of the chart, I navigated to the format tab on the visualization pane.
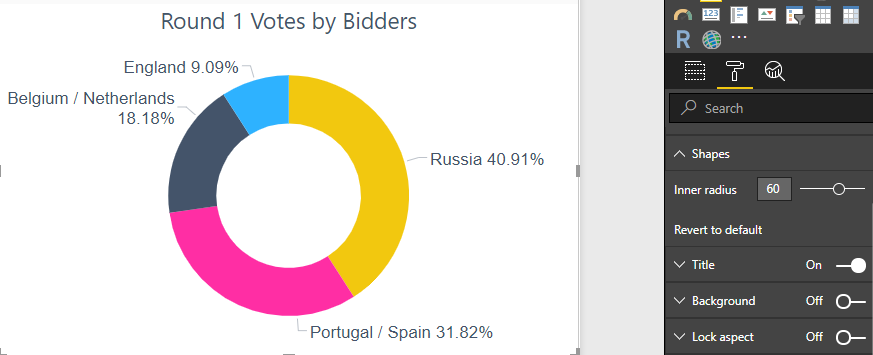
I navigated to Shapes > Inner radius. By default, the inner radius is set to 60. I increased the value to 77.
This increases the white space in the middle of the visual.
Those are my two favorite updates from this month! Next week I will return to my R Series!