Power BI reports are typically used for descriptive analysis: a historical look of what has happened. But what if your report could visualize what is likely to happen and recommend what you can do about it now? This post will cover how to begin the shift from descriptive to predictive analysis by demonstrating three ways to integrate predictive models from R into Power BI.
What is being analyzed?
The business case and data set I use to demonstrate this integration is based on Premier League Fantasy Football.
The goal of fantasy football is to score as many points as possible over the season. Points are scored by Premier League players based on their performance in real life matches.
Fantasy owners must pick a team of fifteen players while being subject to two mains constraints:
- Price – The total cost of all fifteen players must not exceed £100 at the start of the season
- Position – Each team must have two goalkeepers, five defenders, five midfielders and three forwards
Player price is set by the market within the fantasy game: as more team owners buy a player their price will increase and as owners sell a player their price will decrease.
This is an important dynamic to consider, as player price appreciation can result in a higher budget to spend on your team.
Each owner is permitted one free transfer a week to update their team throughout the season.
Descriptive Analysis
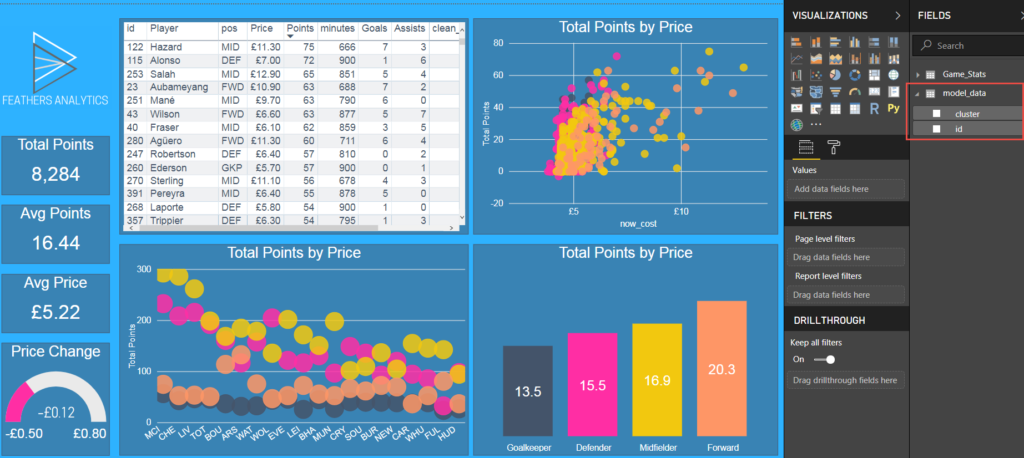
To begin the analysis, I created a Power BI report. Building the visuals allowed for a quick exploration and understanding of the data. I decided to focus on three main features of the data set:
- Points scored – what I am trying to maximize to win the game
- Player price – one of the main constraints when selecting players
- Player position – another constraint when selecting players
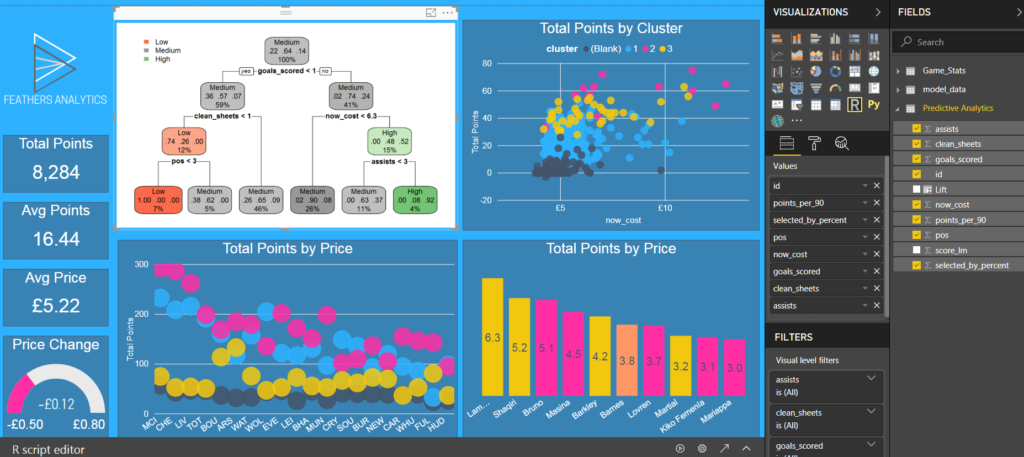
My report contains four main visuals depicting the three features of the data outlined above. I also included some summary statistics to reference when interpreting these visuals.
Predictive Analysis & Integration
I created three different predictive models in R to gain a better understanding of the relationships and patterns in the data. I used the following techniques:
- K-Means Clustering
- Linear Regression
- Classification Tree
Each model will be used to illustrate a method to integrate predictive analytics into Power BI:
- R Script Data Connector
- Run R Script – Power Query Editor
- Custom R Script Visual
R Script Data Connector
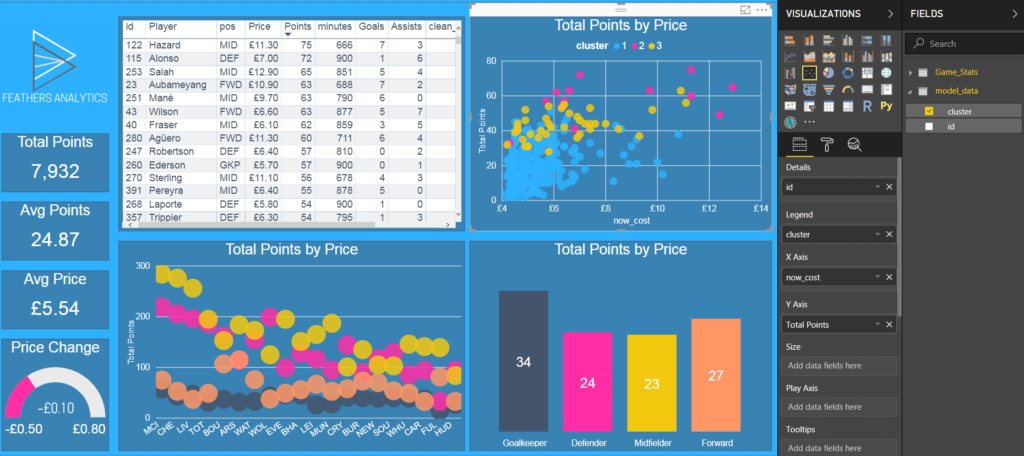
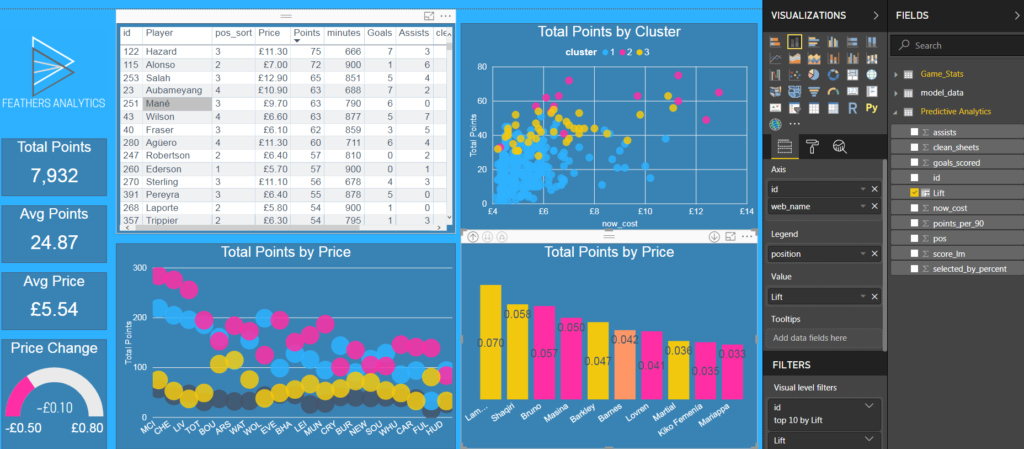
The first model I integrated into the report was the K-Means clustering model. This technique created three clusters and assigned each player to one of these clusters based on the characteristics they exhibit.
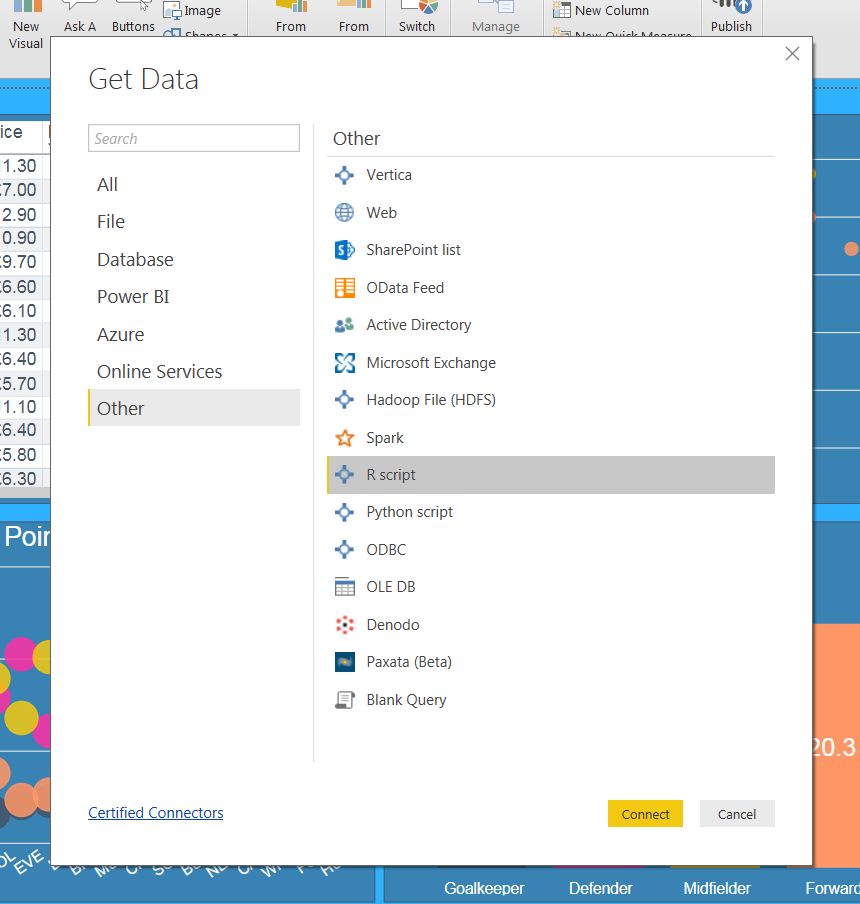
To connect to the results of this analysis, I navigated to the Get Data button on the ribbon. The R Script Data Connector is available under the Other section of the Get Data window.
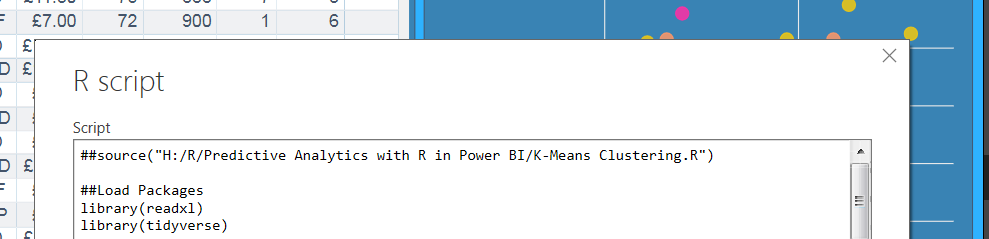
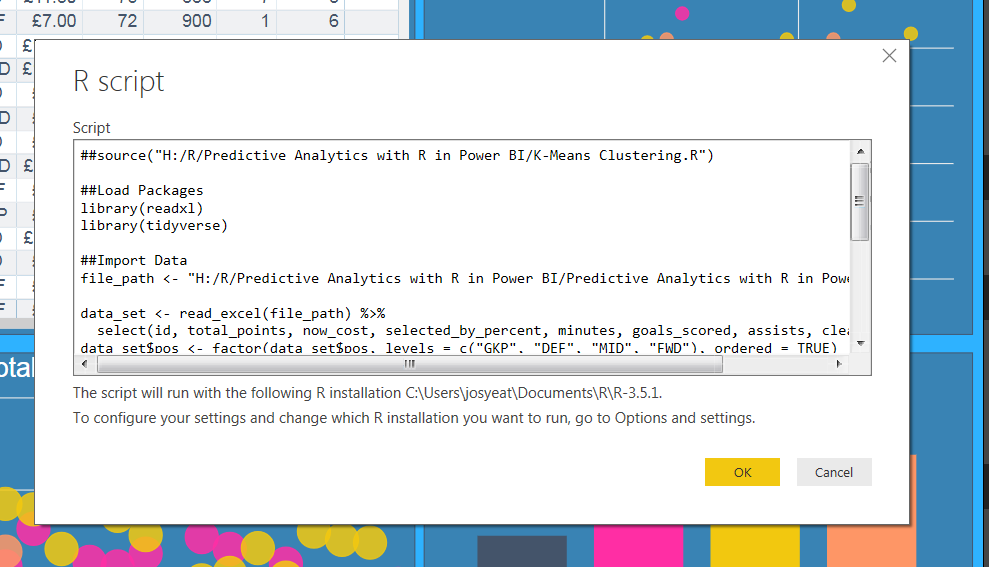
After selecting the R script option, I pasted the following script in the R Script window.
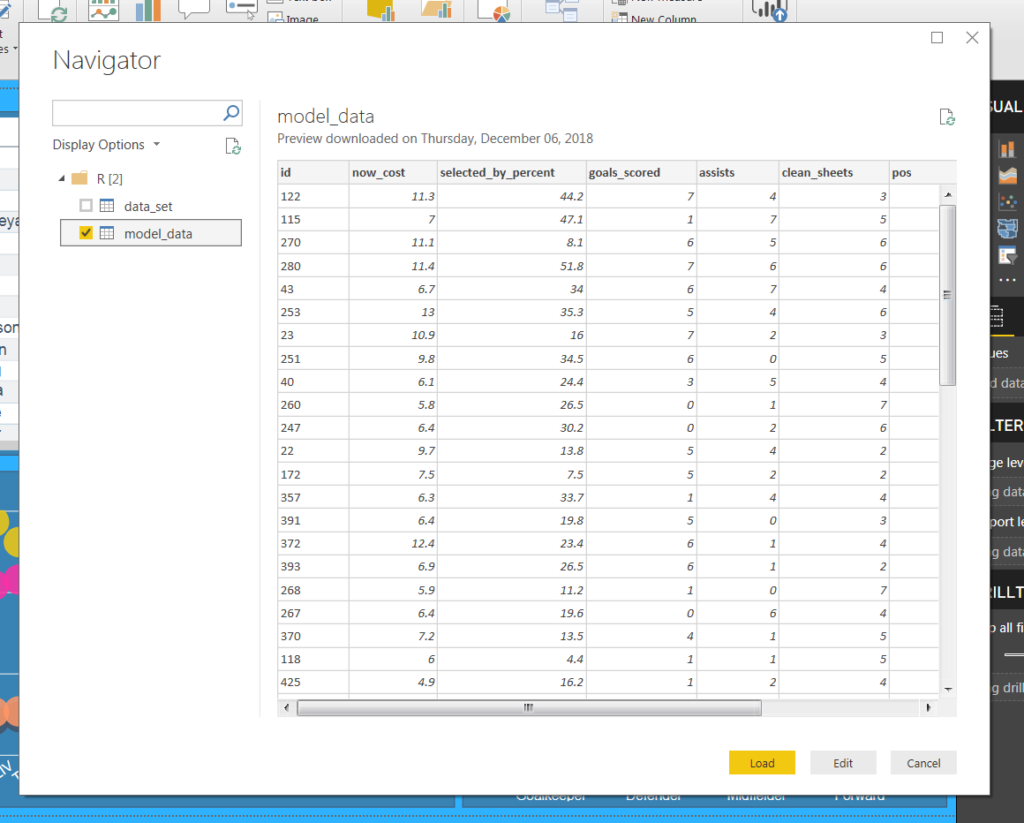
After pressing OK, the Navigator window loaded. I had the option to connect to the two objects I created in my script. I connected to the model_data table.
I loaded this table to the report after removing some of the columns. I related my new model_data query to the existing Game_Stats query using the id column from both queries.
I now had a column containing the cluster that each player belonged to. Even though this column was created in R, it is available to include in my visuals along with data from the other sources already in the report.
I modified the scatter plot visual by using the K-Means clusters as the legend, replacing player position. It is now easy to view and interpret the results of this model.
Run R Script
The second model I integrated into the Power BI report is the Linear Regression model. This technique creates a linear equation to explain how the other variables impact points scored.
I went to the Power Query editor and created a new query by referencing Game_Stats. I manipulated the data in preparation for running the model.
To create the Linear Regression model in the Power Query editor, I navigated to the Scripts section on the Transform tab and selected the Run R Script button.
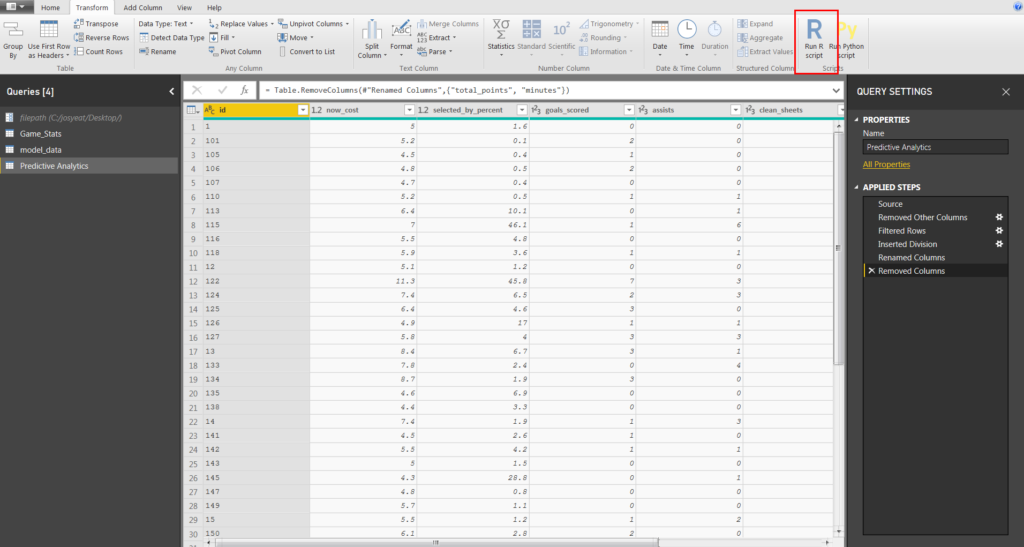
This opened the Run R script window. The query defined in the previous Applied Steps was maintained and stored in an object called dataset. I used this as the starting point to run the R script.
I pasted the following script into the pane.
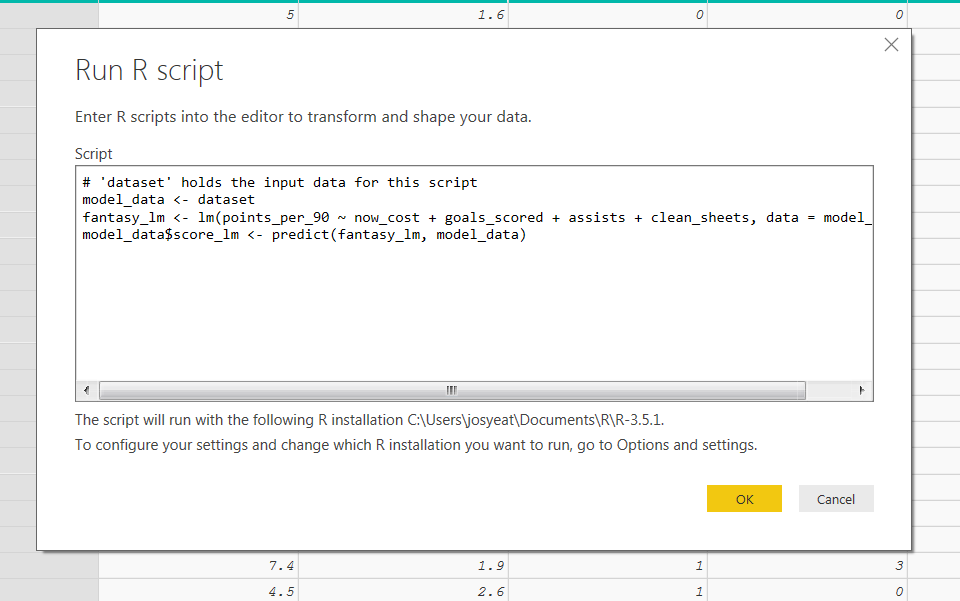
This simple script did two things:
- Created a linear model
- Created a new column containing the predicted points scored for each player based on the model
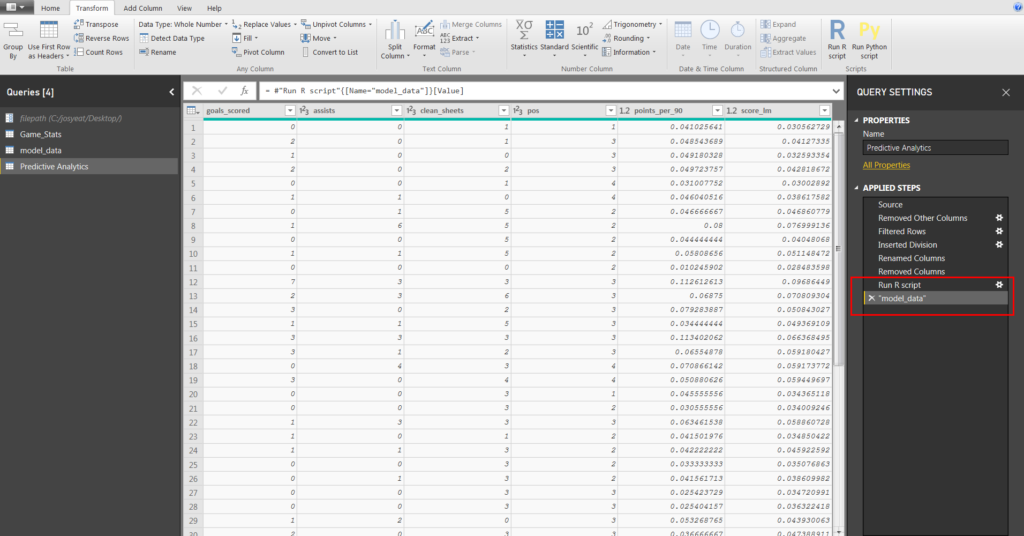
I loaded the query to my report and once again related it to Game_Stats using the id column.
To integrate the results into the report, I modified the column chart to identify the ten players who outperformed their predicted points scored.
This analysis is helpful in both identifying potential players to transfer into my team and identifying possible ways to improve the performance of the model.
Custom R Script Visual
The third (and final) model I integrated into the Power BI report is the Classification Tree model. This technique splits players into different categories based on an optimal set of yes or no questions.
I started by removing the table visual from my report and adding an R script visual. This created a blank visual and opened the R script editor window.
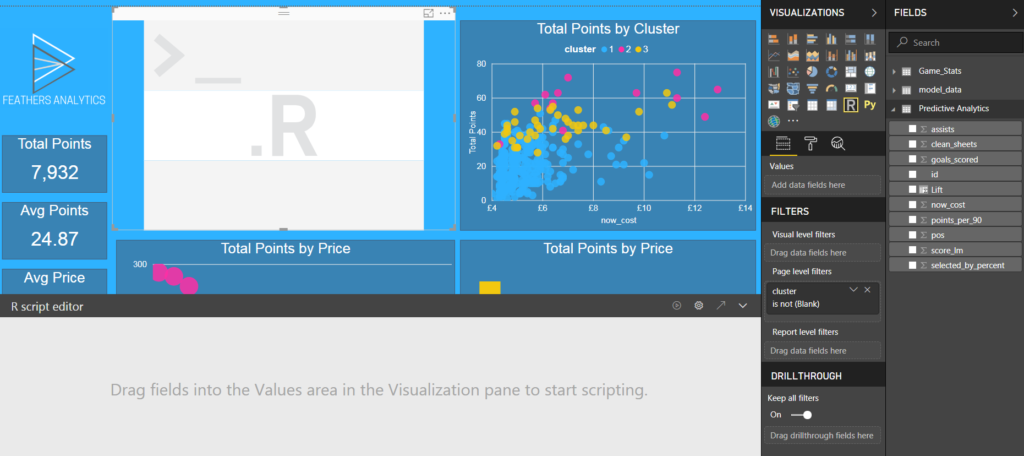
The first step before running a script is to add variables to the Values section in the Visualizations pane. This is important to remember, as the visual will not work unless it has data to visualize!
I dragged the columns I needed into the visual from the Predictive Analytics query.
My next step was to paste the following script into the R script editor.
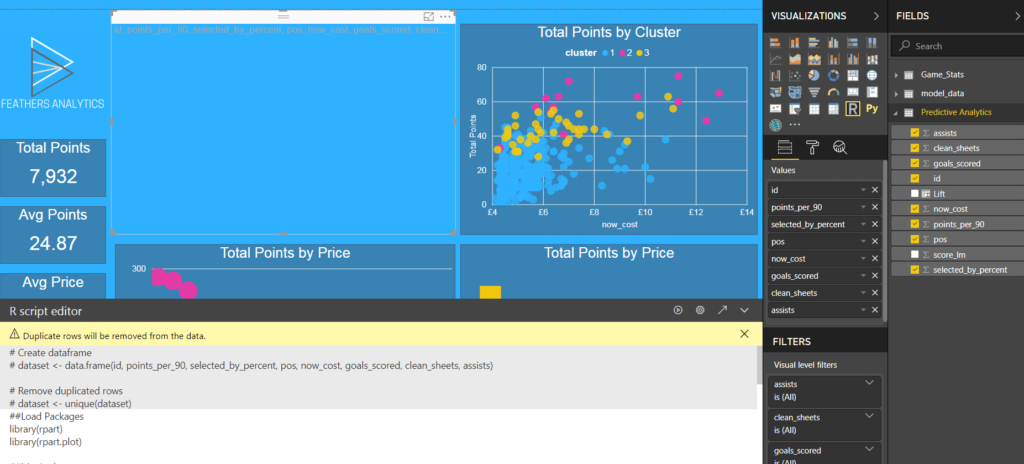
Running the script generated the Classification Tree visual. This visual allows the report user to quickly identify the important splitting points in the data: which variables are important to identify high or low scoring players.
Those are three that I integrate predictive analytics from R into Power BI! My session Predictive Analytics with R in Power BI goes into more detail around the creation of the models and the key concepts and best practices to keep in mind when doing so.