This post covers one of my favorite Power Query topics: the self join! I like using this technique to calculate changes over time, which I will demonstrate with the example below. A self-join merges a query with itself, which allows for a row to gain additional information from different rows in the same query.
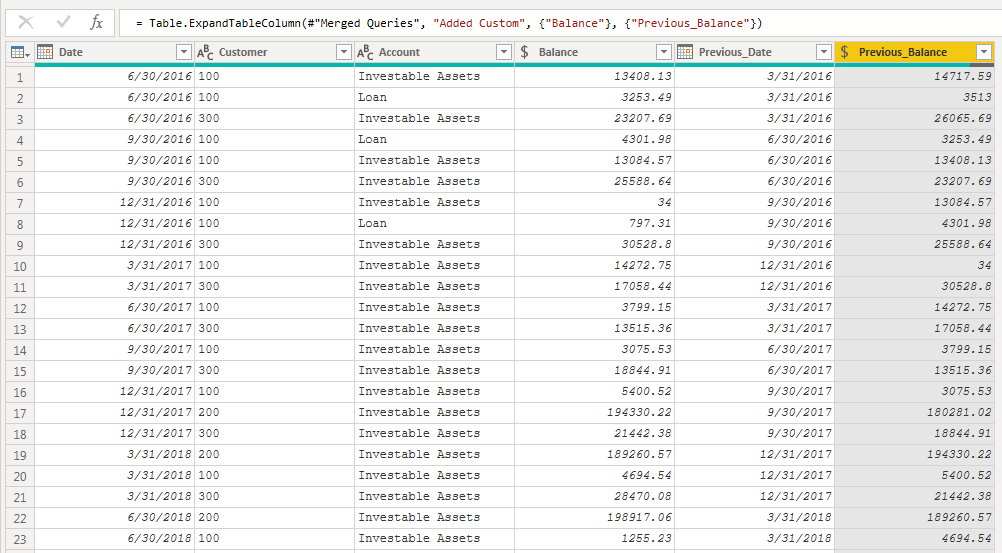
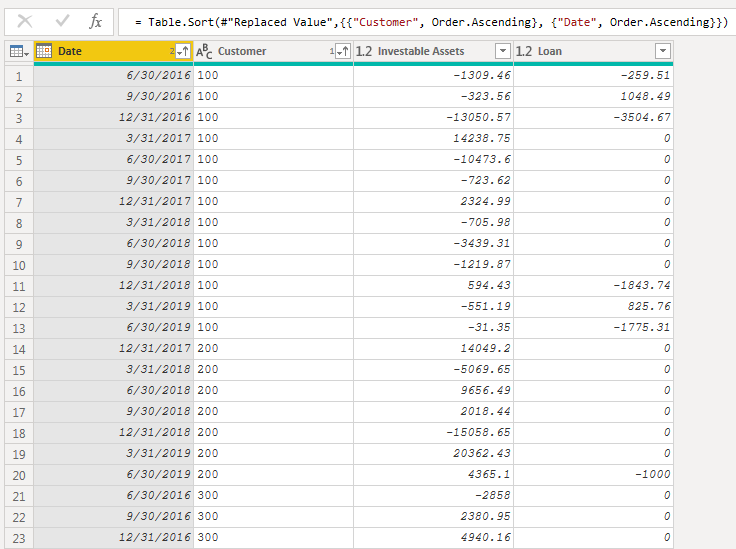
The query I started with contained information about account balances by product, customer and date. My goal was to calculate the change in balance from the previous period.
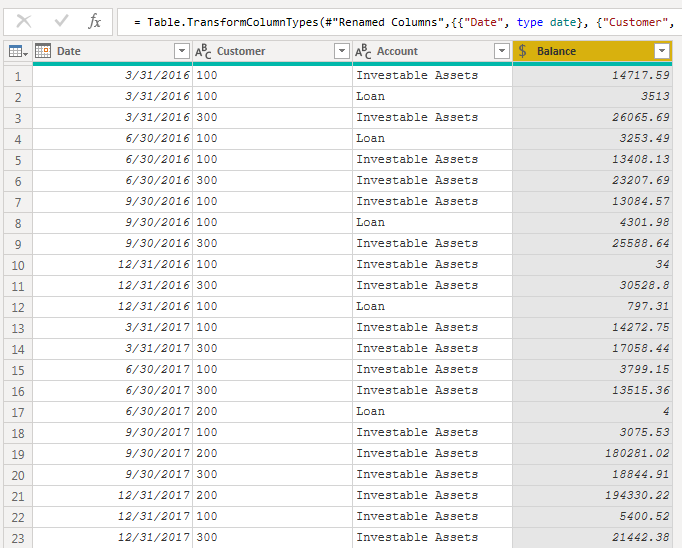
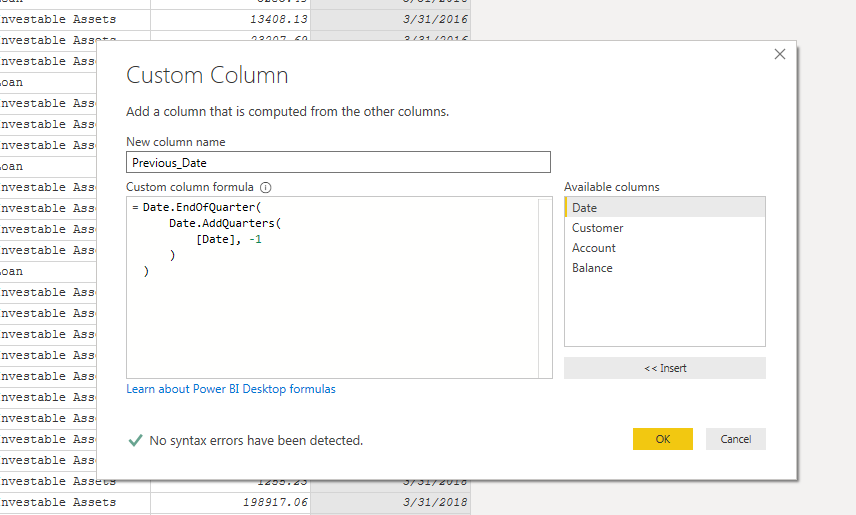
The account balances were reported on a quarterly basis, so my first step was to add a custom column that returned the date of the previous quarter. I used the =Date.AddQuarters() function and wrapped it with =Date.EndofQuarter() to return the end of the previous quarter.
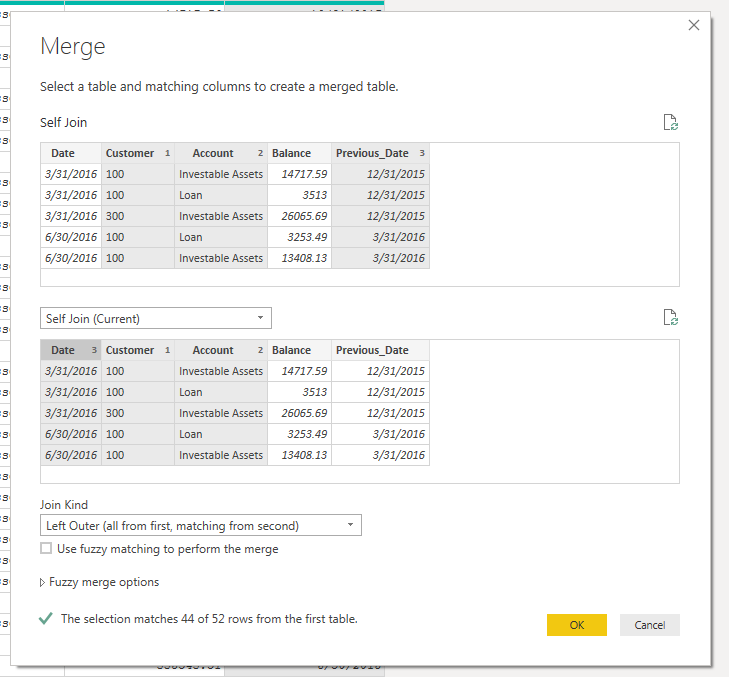
Then came the fun part: the self join!
I merged the query with itself, using the Customer, Account and new Previous Date column on the Customer, Account and Date column.
This returned data for 44 of the 52 rows in the query. This was expected, as the earliest date in the query will have no records from the previous quarter to return.
I only need to expand one column, the previous balance. This resulted in the current balance and the balance of the account in the previous quarter all in one row!
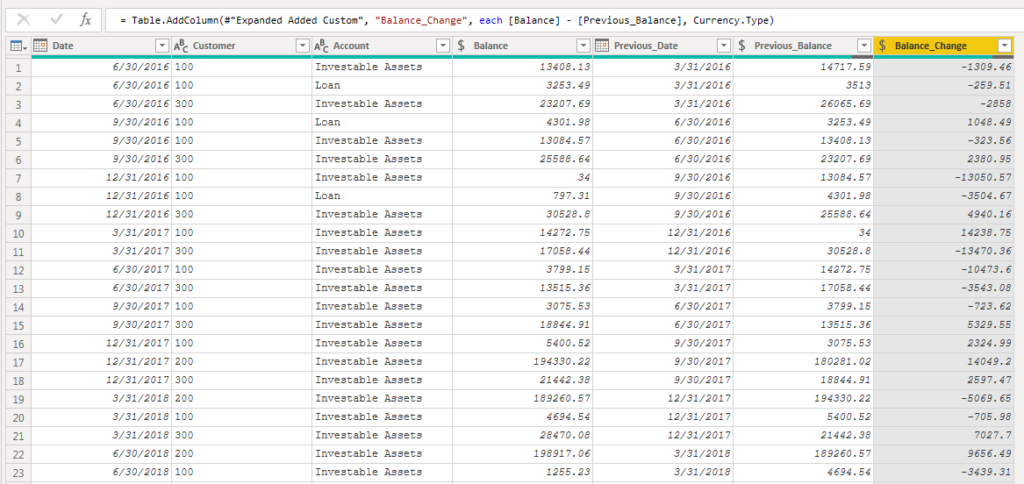
The next step was to create a column with the balance change. To calculate the change in balance, I subtracted the previous balance from the balance of the current quarter.
At this point, all of the calculations were complete. There was some remaining transformation left to do with the final Power BI report in mind.
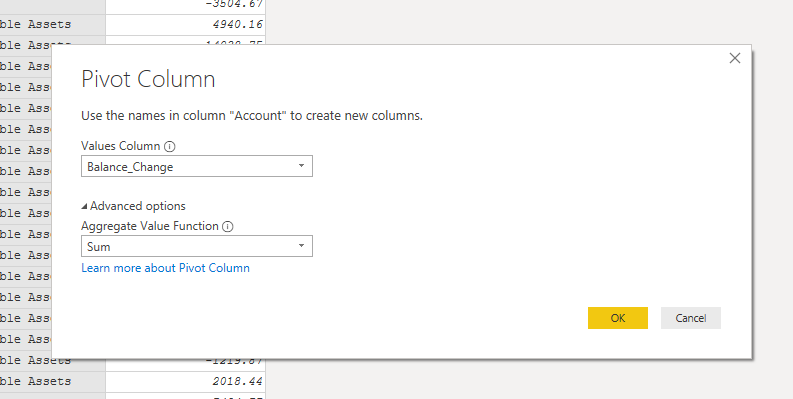
I wanted to have a column for the change in balance of both Investable Assets and Loans. To achieve this, I pivoted the Account column and filled it with the Balance_Change column.
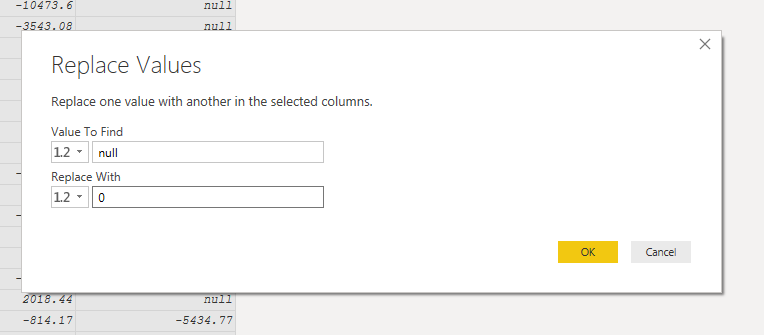
Pivoting the column introduced some null values. I replaced these with the value of 0.
All the data transformation was complete! I sorted the columns and closed the Power Query Editor.
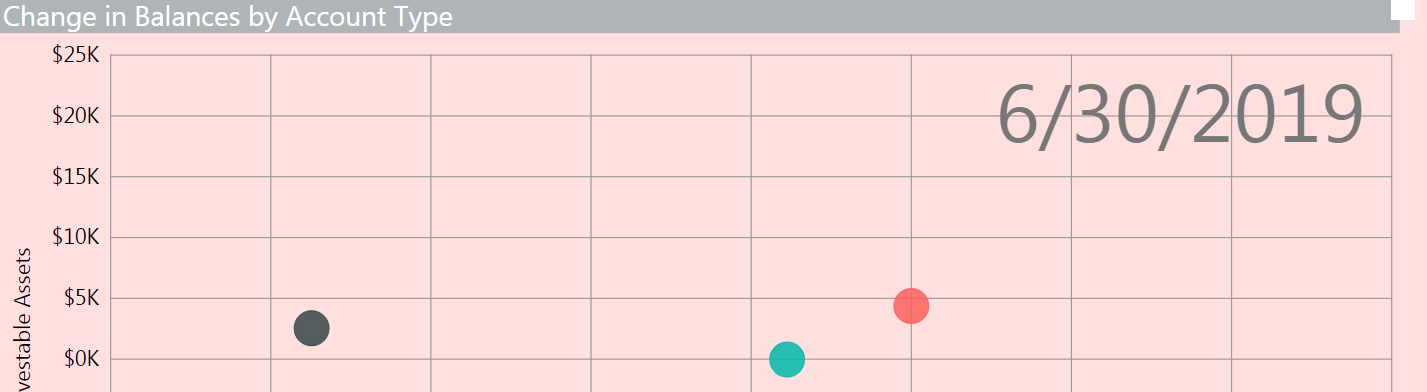
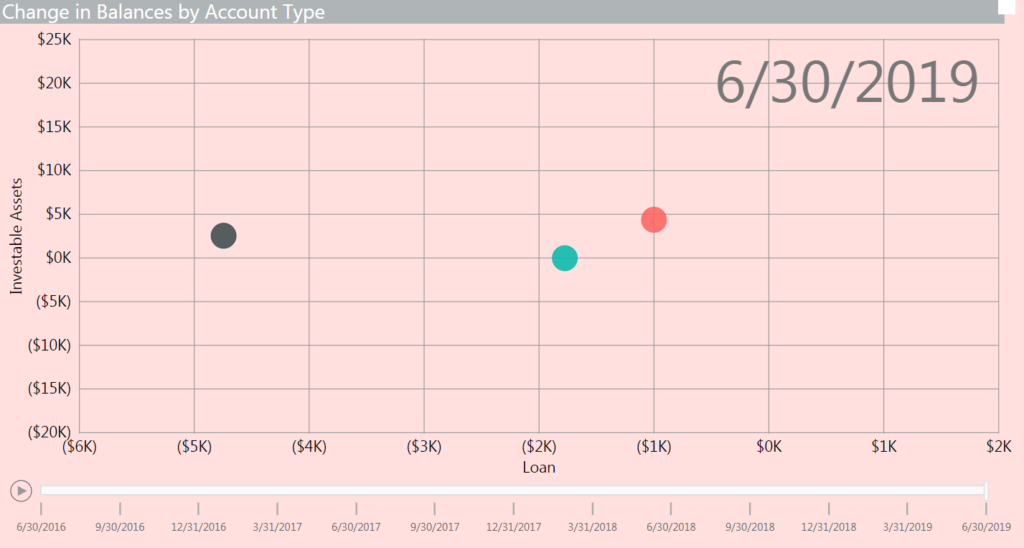
Splitting the two account types into their own columns allowed me to create a scatter plot with change in Investable Assets on one axis and change in Loan balance on the other axis. The date can be used on the play axis to see the change in balance for each customer over time.
Excellent! I tried creating an indexed column based on grouped data. I don’t understand why when I self join the tables the index is suddenly changed and I can´t do my reference.