Another month where I highlight three of my favorite features from the latest Power BI update. This month, I cover features from the areas of reporting and data preparation. The full documentation, covering all of the features from the update, can be found here.
New action types for buttons
Buttons are one of the best features in Power BI for creating an app like experience within a report. This new feature allows for buttons to do more actions.
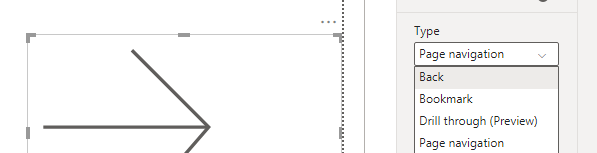
Page Navigation
A user is now able to navigate to a different page of the report without having to select a page on the bottom of the report, using a bookmark, or drilling through to another page.
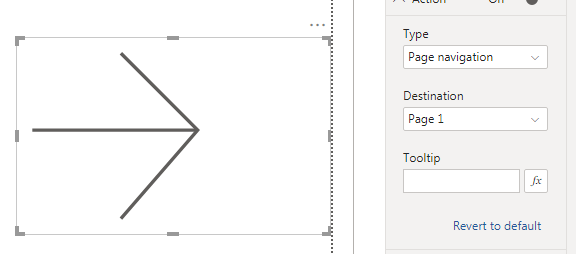
To set up page navigation, toggle the Action option from the button Visualizations menu. Then, under Type, select Page navigation and the page to navigate to under Destination. There is also the option to create a tooltip for the button as well.
Drill through (preview)
I ‘m very pleased that drill through has been introduced as a button action in this release. The drill through functionality is a bit hidden from the user, as it requires a right-click on a visual, selection of drill through and then the page to drill through to.
Having a button makes this much easier. To use this new feature, the report needs to have a page drill through set up already. The author can then enable the drill through with a button. I like the options of tooltips for both an enabled and disabled drill through.
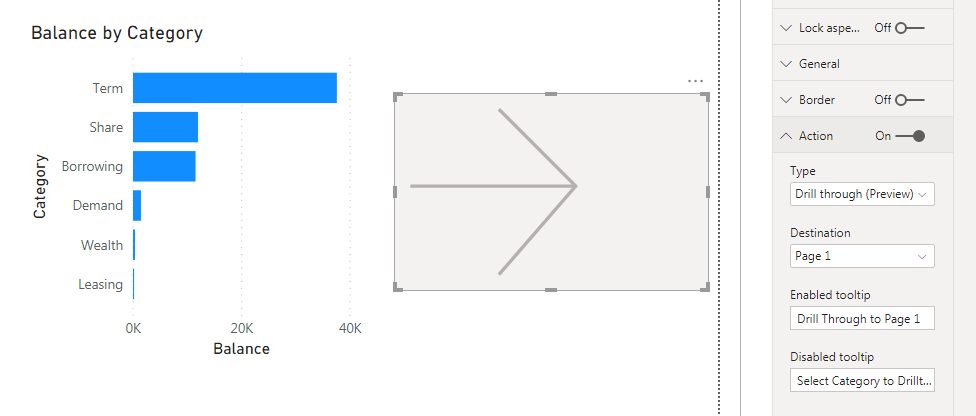
After setting both options, the tooltip will either prompt the user to make a selection from the visual or to use the button to drill through to another page.
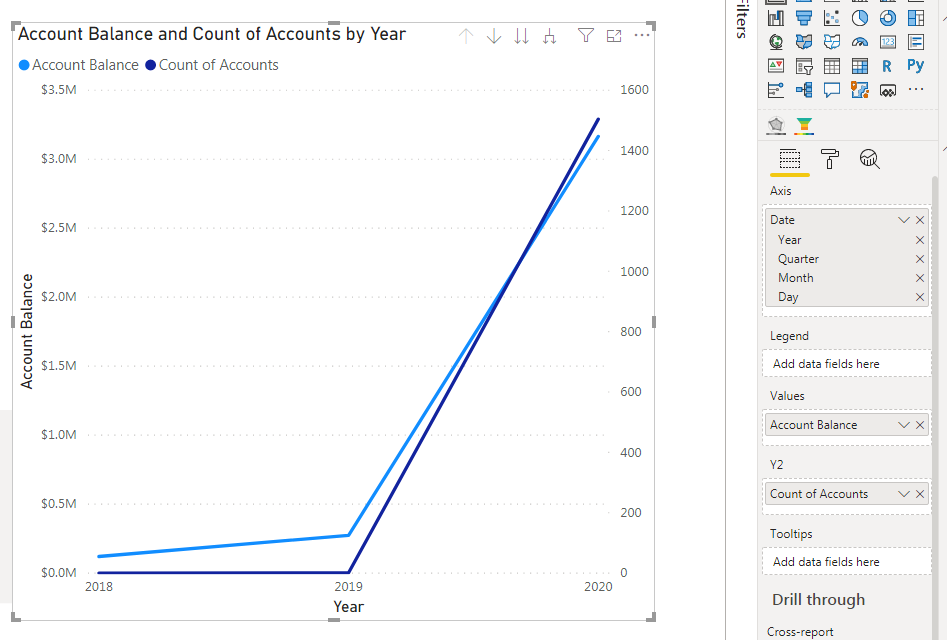
Dual axis for line chart
This eliminates another minor pain point from Power BI! Multiple measures were supported in line charts before, but they were limited to using the same axis. This was impractical if the measures where orders of magnitude different from one another, but relevant to be viewed together.
Now, the visual can contain more contextual information, such as both balance (in the $ millions) and count of accounts (thousands) in the same place.
Query diagnostics is now generally available
Query diagnostics provides the report author some understanding to what is actually happening when the report is refreshed. This includes the report data source connections and the time spent on various actions.
The full documentation for query diagnostics can be found here. A helpful blog post outlining the general availability of query diagnostics can be found here.
I have outlined below where to find query diagnostics and the two different types of diagnostics that can be run.
To enable this functionality, open the Power Query editor and navigate to the tools tab on the ribbon. There are two options: start diagnostics or diagnose step.
Recording diagnostics for an action results in two queries: an overview and detailed breakdown. Both contains information such as:
- which query and step was analyzed
- the operation performed
- the start and end time of the operation
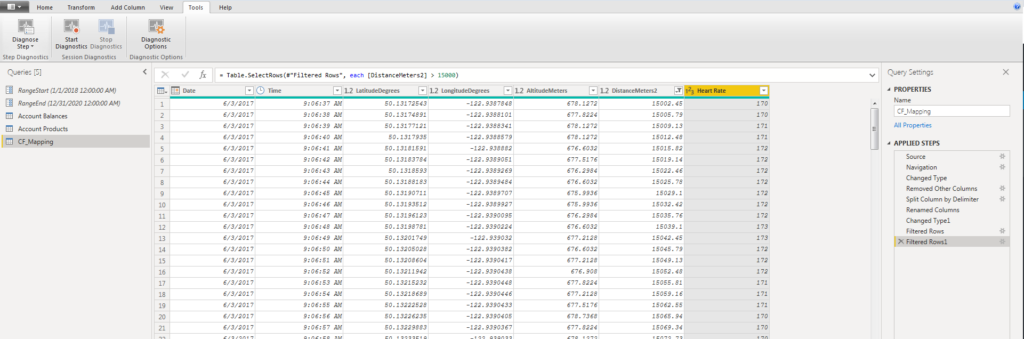
However, they are displayed at different levels of granularity. I filtered both queries to show the information for my Filtered Rows step. The overview provided three rows.
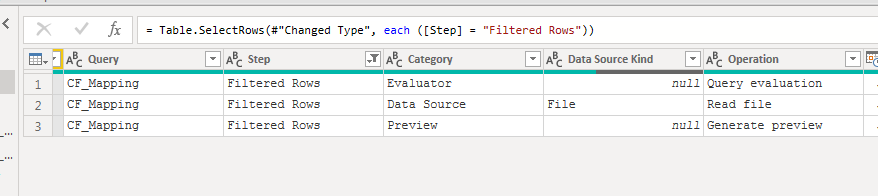
The detailed breakdown returned six rows for the same step.
I would also highly recommend watching the Power Query portion of this Guy in a Cube video. Adam provides an easy to follow example on how to trouble shoot refresh issues within the Power Query editor.
That’s all for this month! I’m looking forward to the April release, as I will be sharing and presenting my favorite features to the Vancouver Power BI User Group with our first ever remote session!