The phrase “insights from data” has become an inside joke at my workplace. Having said that, everybody loves the insights generated by machine learning within Power BI Desktop.
The ability to analyze data for automated insights has the biggest “wow factor” of any of the functionality I consistently use.
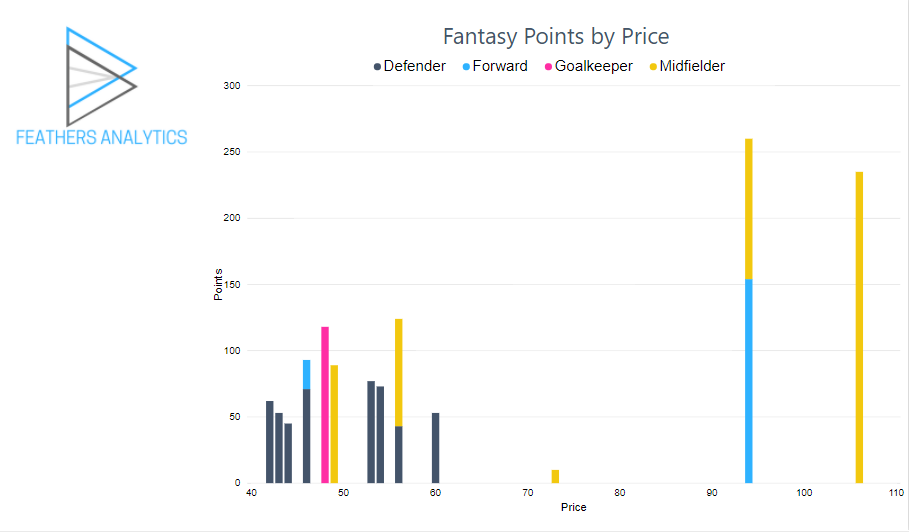
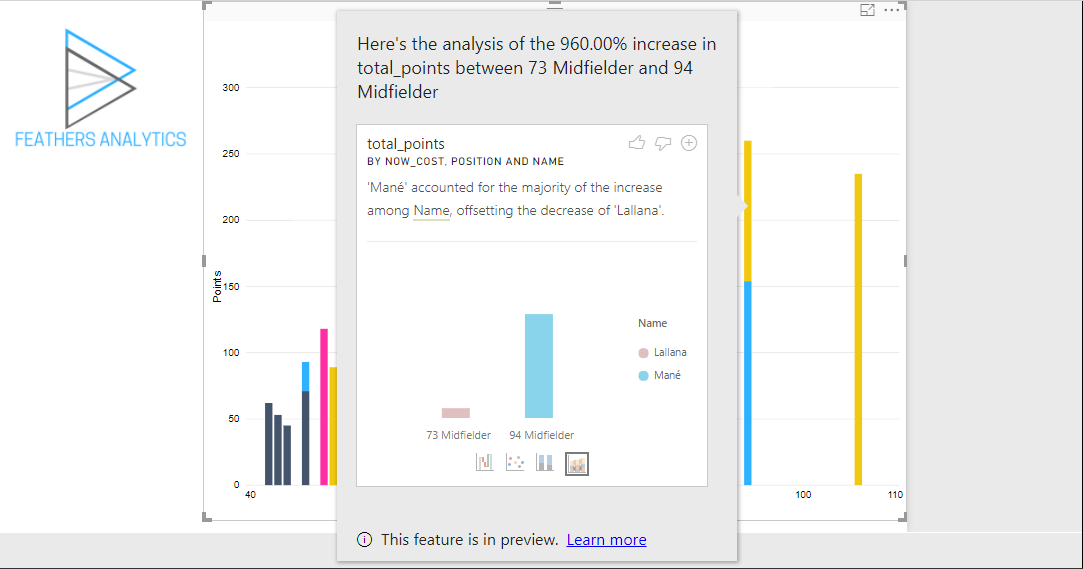
To demonstrate how to use insights, I used a basic column chart with some Premier League Fantasy Football data. The chart plots the price of a player along the x-axis and the number of points a player has scored along the y-axis.
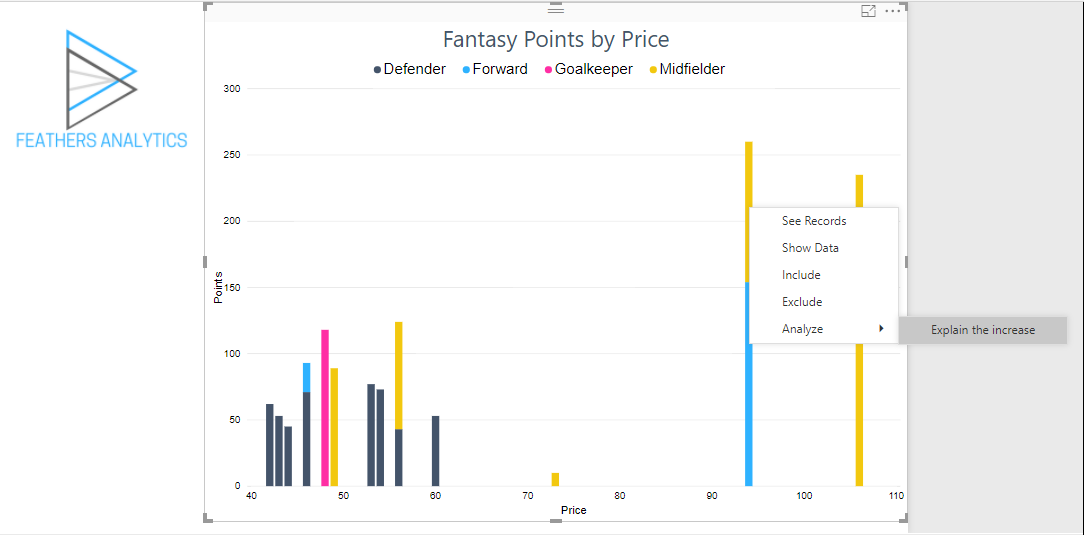
To generate an insight, I right-clicked on one of the bars. In this case, the yellow midfielder column with a price of £94.
I selected Analyze, Explain the increase. The option can also read “Explain the decrease” if the value has decreased from the previous data point in the series.
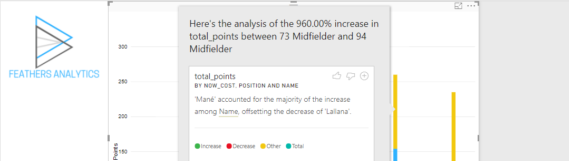
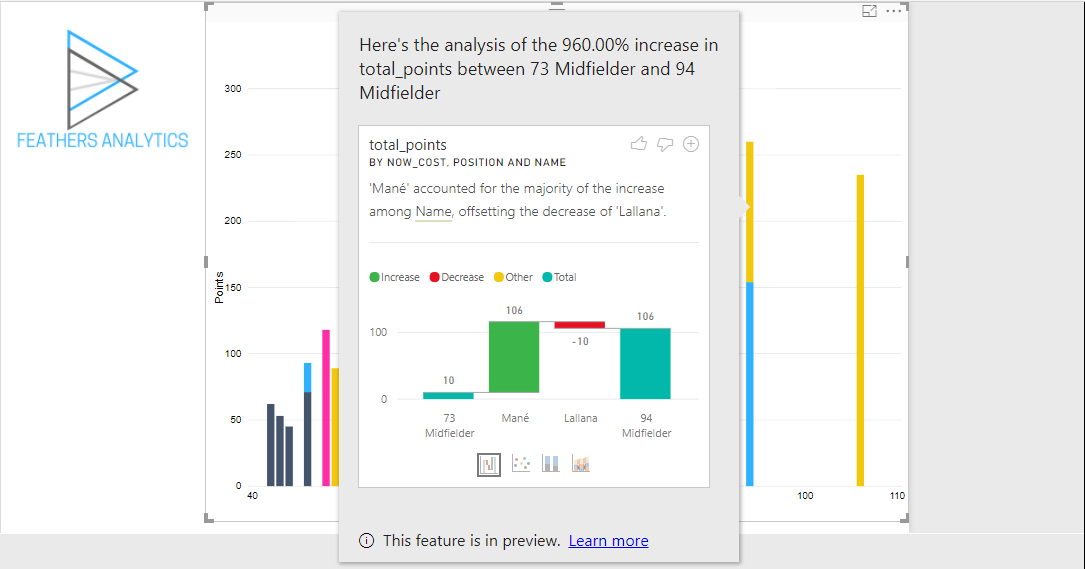
The first insight was visualized with a Waterfall chart. Most of the increase in points from midfielders with a price of £94 compared to midfielders with a price of £73 can be attributed to Sadio Mané.
This insight was visualized using three other charts as well. The four visuals that display an insight are:
- Waterfall Chart
- Scatter Chart
- Stacked Column Chart
- Ribbon Chart
I also inspected the Ribbon chart:
I liked both the waterfall and ribbon visualizations of the insight and wanted to add them to my report.
This is made easy by selecting the “Add to page” plus sign on the top right of the insight visual.
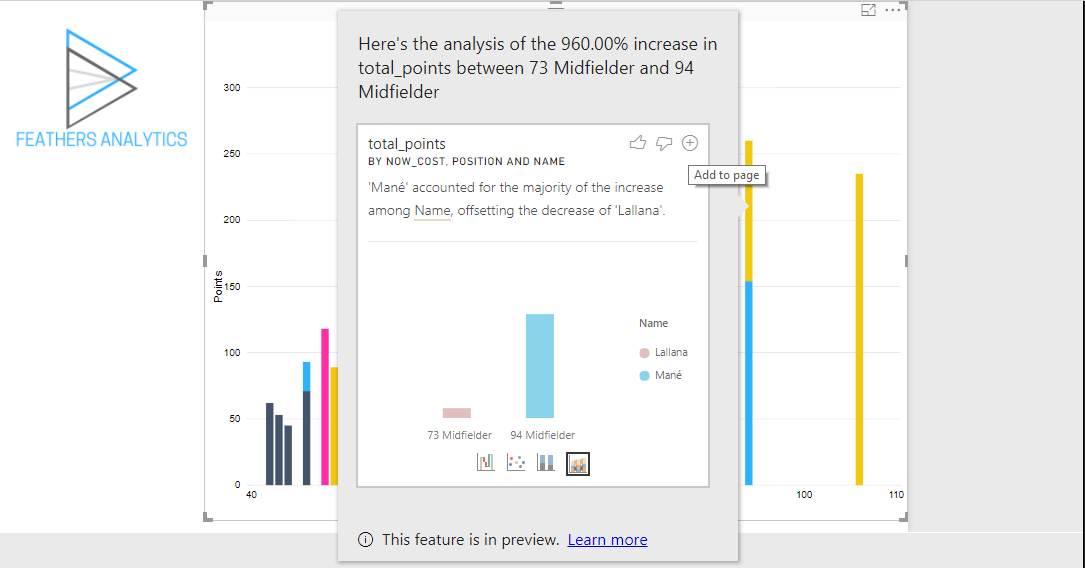
I used this icon to add both the Waterfall and Ribbon charts to the report. I changed a bit of the formatting to make the visuals easier to read.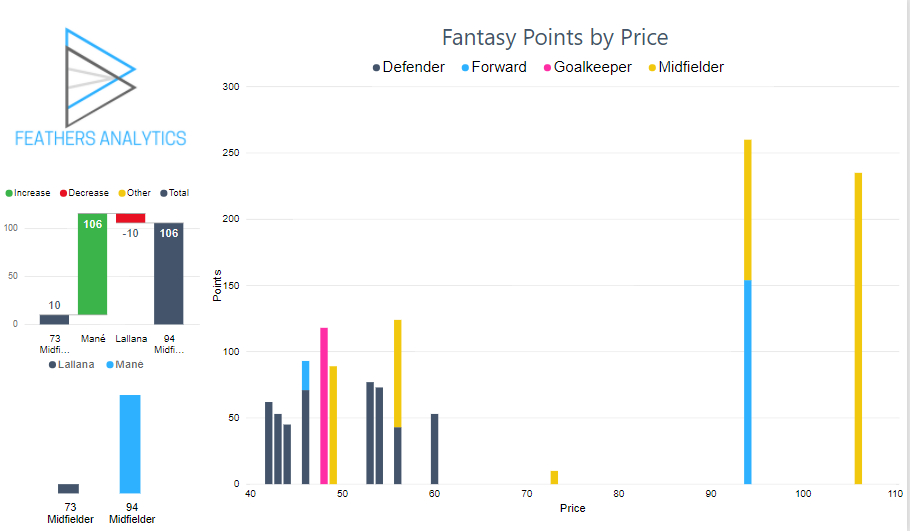
The insights generated by machine learning algorithms can save time analyzing data. Typically, I will visualize data sets to do some exploration and gain a better understanding before starting to analyze and build narratives .
Using insights in Power BI helps speed up this process. I like that any of the visuals generated can be quickly added to the report canvas as well.
There are some limitations of this feature, which are outlined here in the documentation. I’m looking forward to this feature improving over time and delivering even more valuable insights.
I really like your blog and those FPL posts! One question, where can I find players positions? I cant see it in https://fantasy.premierleague.com/drf/elements/
Thank you for the feedback!
I connected to https://fantasy.premierleague.com/drf/bootstrap-static which includes more than just elements (player information). Positions are defined by element_types.
thank you, much appreciated!