As promised last week, the R script data connector. This is the second part of my overview of integrating R with Power BI. I have often been asked:
What is the point of using an R script to manipulate data? Why not just use Power Query?
For a user who is comfortable with Power Query and Power BI, I think that is a perfectly legitimate question. However, for more advanced data manipulation, or supplementing existing report data, connecting to an R script is a valuable tool.
The process to connect to an R script is similar to other data connectors in Power BI. There is just a bit of configuration to be done prior to using the connection for the first time. This is defined in the R installation and configuration options, located in File > Options and settings.
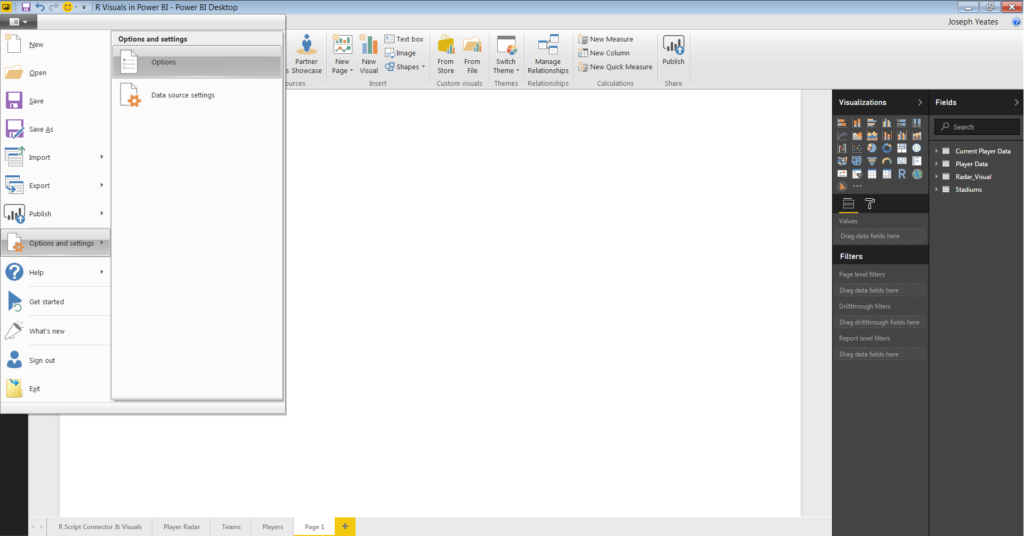
Under Global options I selected R scripting. There are two options to configure:
- R Home Directory
- R Integrated Development Environment (IDE)
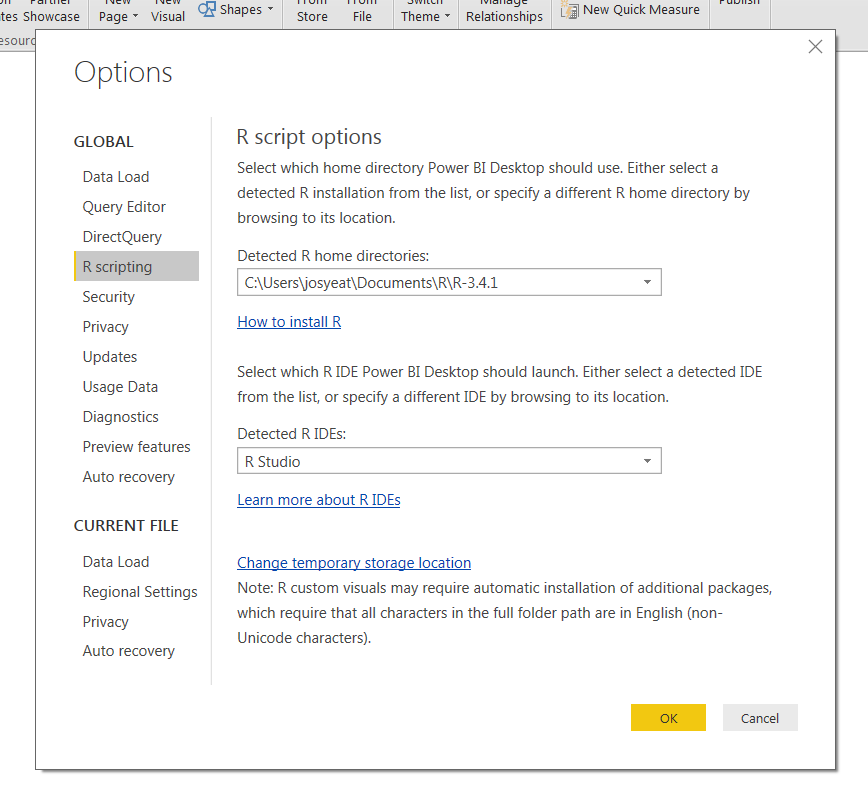
The R home directory is the top-level directory of the R installation being run. The directory should be detected automatically, but can alternatively be selected from the drop down. This defines the engine that will run the R script and power the R visuals within Power BI.
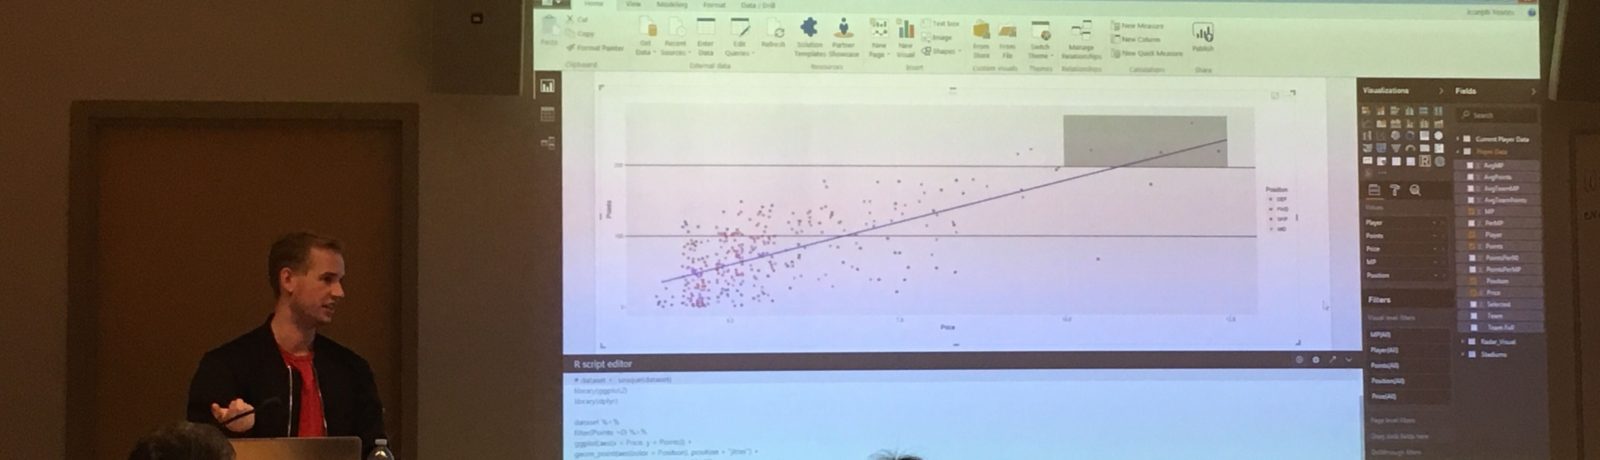
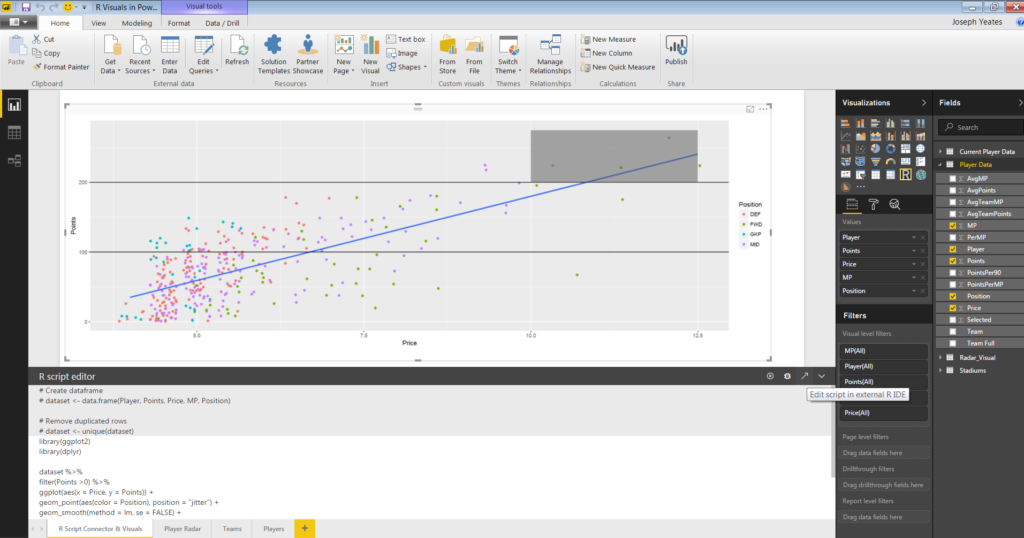
The R IDE comes into play when creating R visuals in Power BI. There is an option to launch the script editor in the defined R IDE (as shown below).
Now that the home directory and IDE were configured, I could begin connecting to my R script. Similar to connecting to other data sources in Power BI, I went to Get Data and selected the More.. option from the drop down menu.
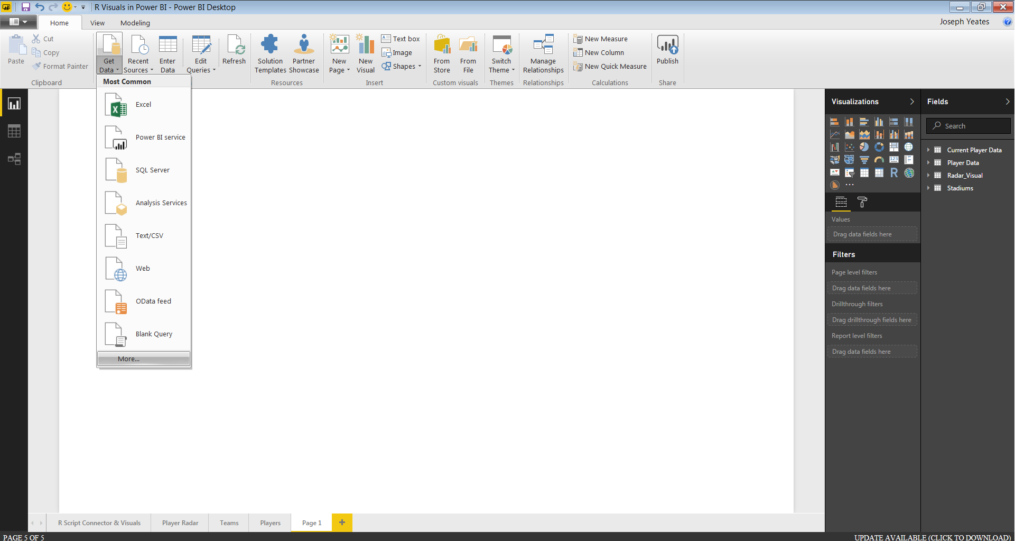
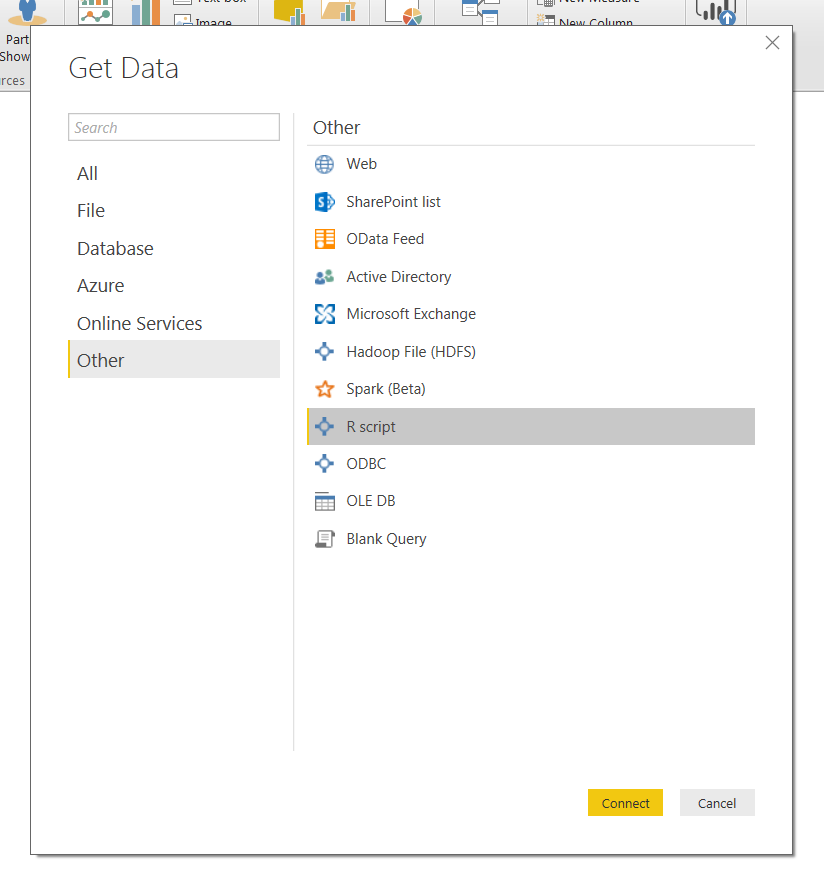
This takes me to the Get Data pane. I selected the Other option from the data source type and then R script from the list of options.
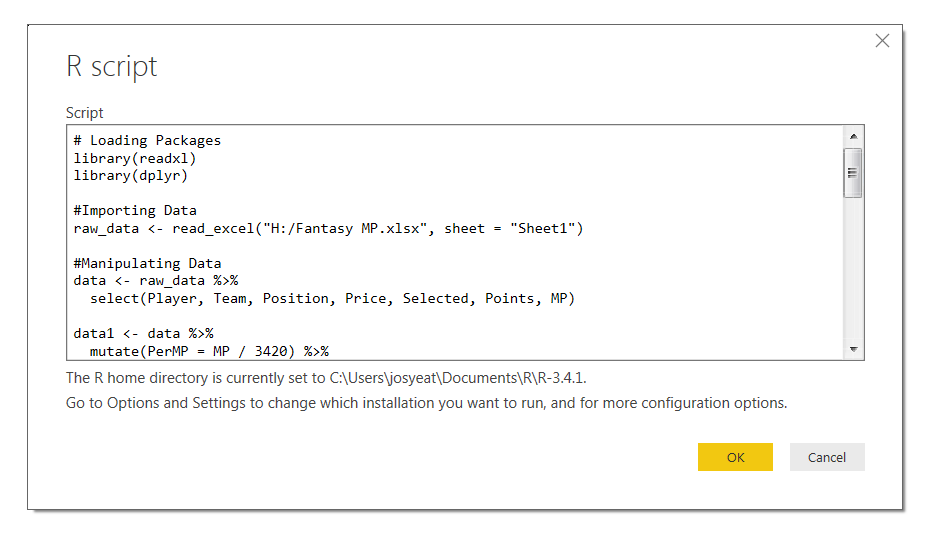
After selecting Connect, the R script page opened. The loads a blank script pane onto which I copy and pasted my code from R Studio. Below the pane, there is a statement identifying which R home directory is currently in use. This is consistent to the directory defined earlier.
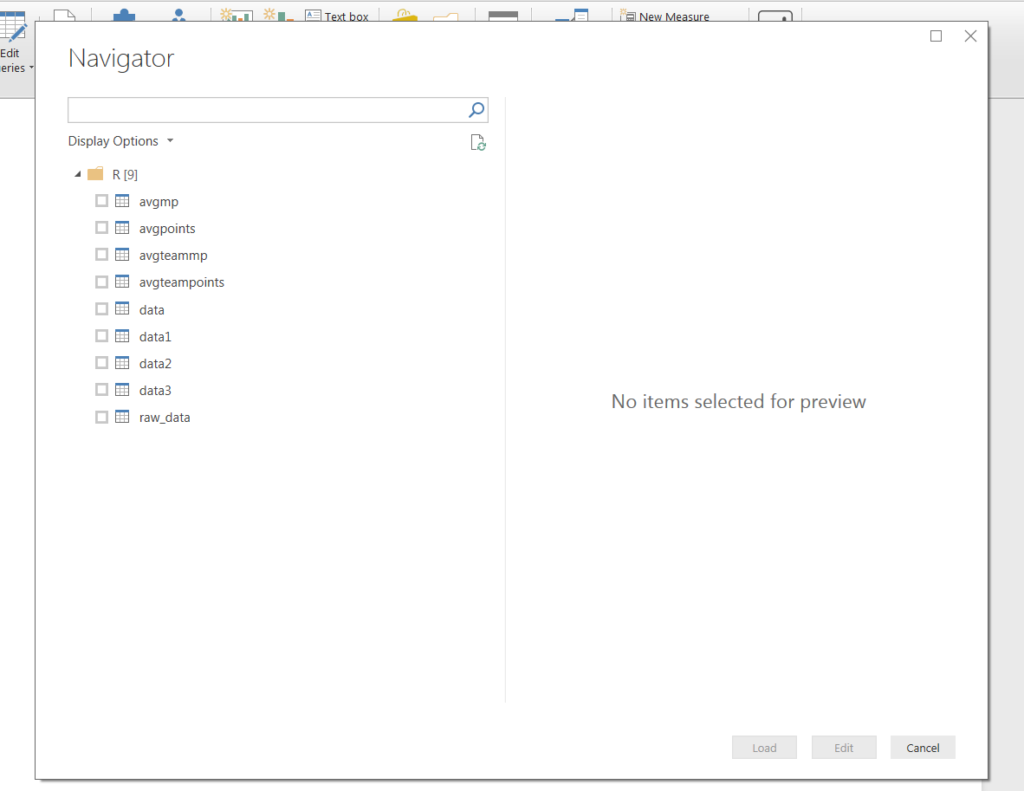
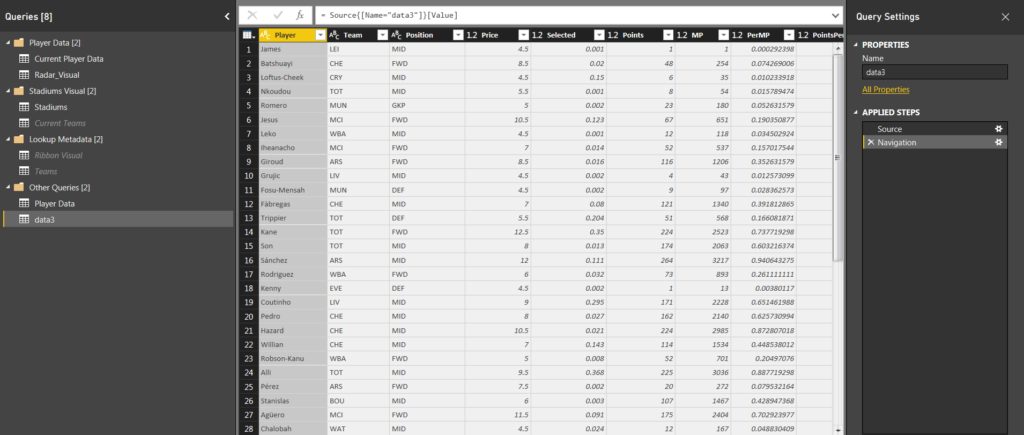
I selected OK, which ran the script and opened the Navigator pane. The script generated nine entities to connect to. I only needed the final data set, so I selected the data3 entity and loaded to the query editor.
The data set defined in my R script opened in the Query Editor. There are only two Applied Steps: Source and Navigation, both of which I defined in the Get Data and Navigator interface. My script was ready to load into my Power BI report to start building visuals!
This was my second post on using R in Power BI. My first post covered building custom R Visuals. I am planning to write more about R in the coming weeks/months. If there are any questions about R or Power BI and how they integrate together, please connect with me on Twitter! All of my contact information is found under the blog post or at the bottom of any page on my website.
1 thought on “Power BI R Script Data Connector”
Comments are closed.