Another month, another Power BI update! This is the second post in my new series reviewing the monthly Power BI Desktop updates. Every month, I select three of my favorite new features to review.
This month, the report used to demonstrate these features is a sneak-peak of my submission to the Year in Review Contest. Be sure to check it out on the projects page at the end of the month!
Top N Selection in Q&A
I introduced Q&A in my monthly update post for December 2017. Just a month later, there has already been an enhancement to the natural language querying.
This feature is accessed the same way as other Q&A functionality, by either:
- double clicking on the report canvas
- navigating to the Ask A Question icon in the Insert section of the Home tab on the ribbon
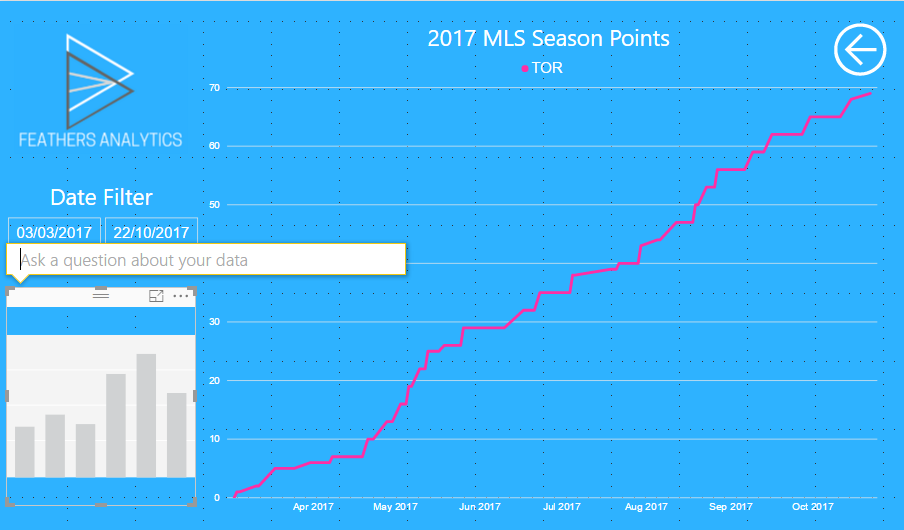
This will create a blank placeholder visual as well as the “Ask a question about your data” dialogue box.
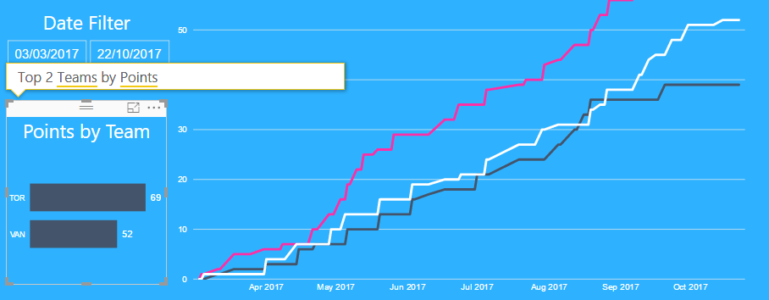
Top N Selection allows for a user to ask a common type of question: performance relative to others.
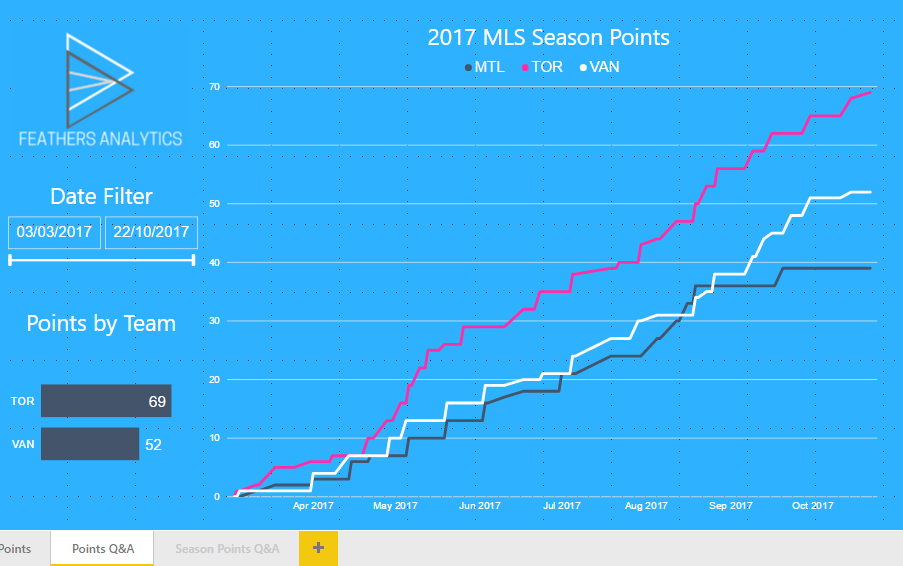
In the report, I wanted to know the two teams that had accumulated the most points over a season. This is now easily accomplished using Q&A.
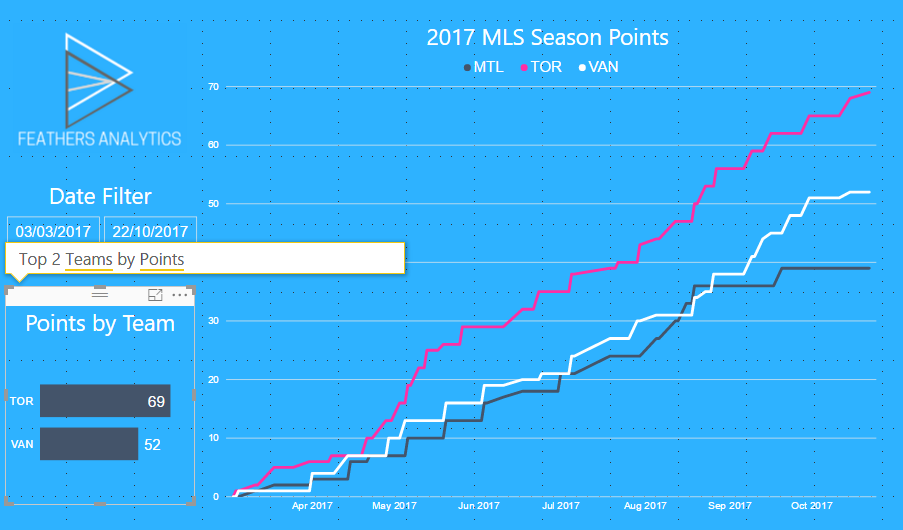
My question generated a bar chart of the two teams from my report with the most points: Toronto and Vancouver.
Show & Hide Pages
Hiding pages is a useful feature to pair with bookmarking and drillthrough in Power BI reports.
You might not want users to be able to navigate to certain pages unless it has been filtered by drilling through from another page or as part of a bookmark. Hiding a page limits a user to viewing a particular page only through these functionalities.
To hide a page, simply right-click on the page tab at the bottom of the report and select Hide Page.
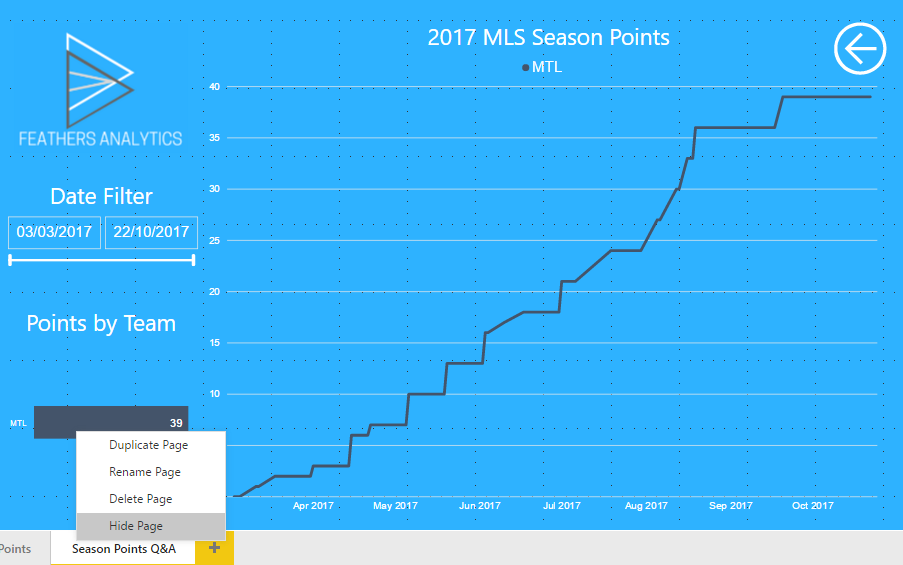
After hiding the page, the tab appears greyed out. This indicates that it will not appear in the report when it is published.
Correlation Coefficient Quick Measure
I love quick measures in Power BI, as the interface does the heavy lifting of writing DAX for you.
As someone who works in data analytics as well as business intelligence, the ability to use a more advanced measure in a report is exciting. A correlation coefficient gives insight into the relationship between two variables.
To access the correlation coefficient, right click on a query or field name in the fields pane and select New quick measure. This brings up the Quick measures pane.
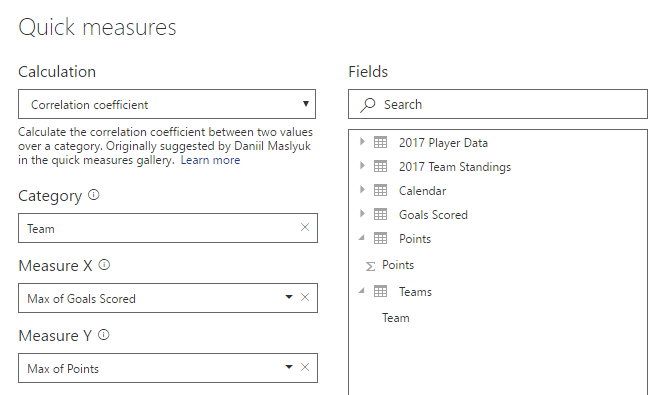
Then, navigate to the Mathematical operations section in the Select a calculation drop down menu and select Correlation coefficient.
To create the measure, a field has to be chosen for category, measure x, and measure y. In the example report, I selected Team, maximum of Goals Scored and maximum of Points.
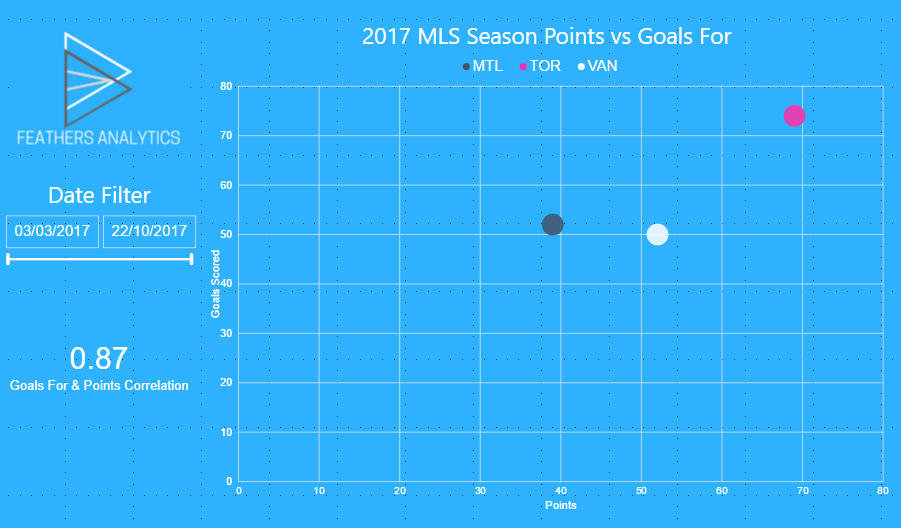
After clicking OK, the measure will appear in the fields pane. I placed this measure in a Card visual.
This allowed me to see that there is a strong positive relationship between goals scored by a team and the points they accumulate throughout the season.
Those are three of my favorite features from the January 2018 update! I have been taking advantage of all three when building my report to submit to the Year in Review Contest.
I will share my completed project, as well as some of my favorite entries, on my social media. Remember to follow me to stay up to date!