Two weeks ago, I saw an awesome presentation at the January Vancouver Power BI User Group. Ken Puls went through an hour showcase of Power Query and touched on every step in the ETL process.
The most valuable aspect I took away was how he created a dynamic date dimension table for his data model. A date dimension is an essential table to have in every data model, especially when using Power Query.
A date dimension table will provide the ability to leverage the powerful date and time intelligence in Power Query; but more importantly, the ability to do so correctly.
This post will walk through the steps to create a dynamic date dimension table. Ken’s post covering this topic can be found on the Excel Guru blog.
Select Start & End Date
The first step in creating a date table is selecting the start and end dates from the source data. In my example, all of the dates I need for my data model are in one source data table. To begin, I reference this source query.
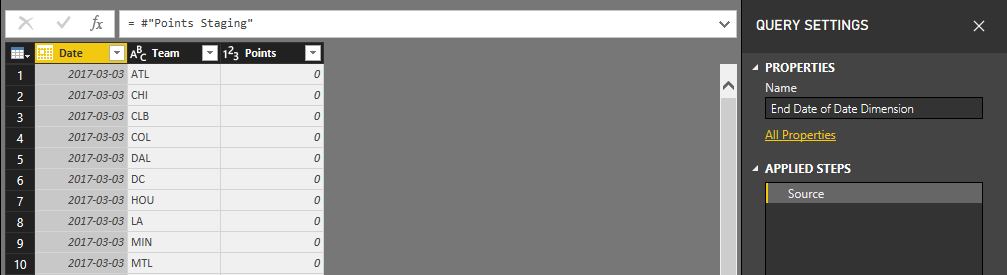
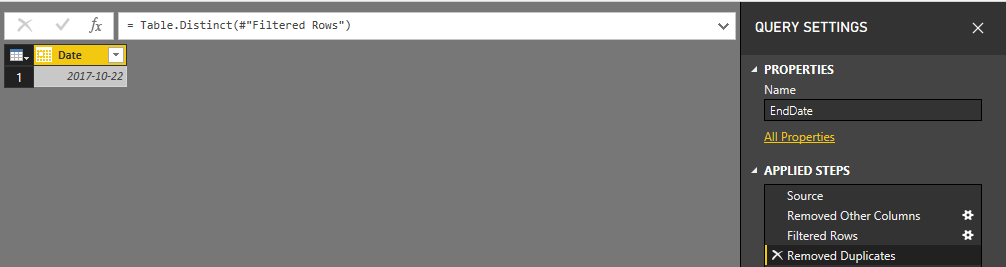
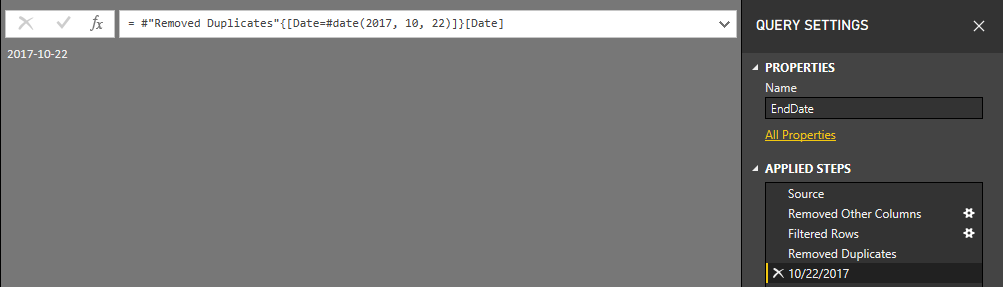
Next, I transformed this query with a series of applied steps:
- remove the other columns
- filter to only include the latest date
- remove duplicates from the column
This transformation will result in one column with one record of data.
Now that the end date has been generated, I right-clicked on the record and selected Drill Down from the menu.
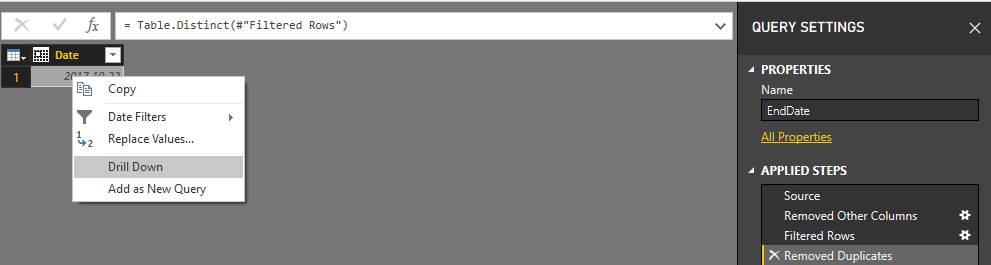
The end result is a date that has been dynamically created from the data. This means that as the source data refreshes, this series of transformations will be reapplied.
This results in an end date that changes with the data. It does not have to be manually updated. This process is created once and will continue to be accurate over time.
Creating Date Dimension
I repeated the same applied steps to get the start date for my date dimension. Now that I have defined the beginning and end of the date range, I need to generate all of the dates in between.
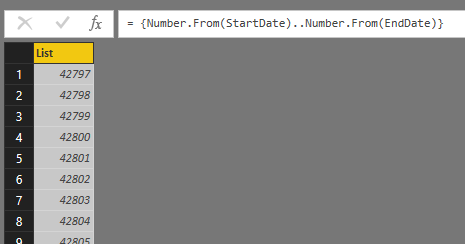
This is achieved through some M code:
= {Number.From(StartDate)..Number.From(EndDate)}
This creates a list of dates, beginning and ending at the dates I had defined earlier from my data.
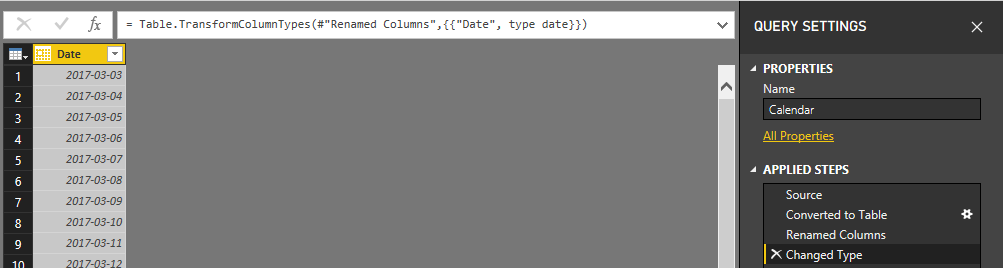
Now that I have my list, I transformed this list with some more applied steps::
- Convert the List to a Table
- Renamed the Column to Date
- Changed Type to Date
This results in a single column of dates I can use to begin to create the date dimension table.
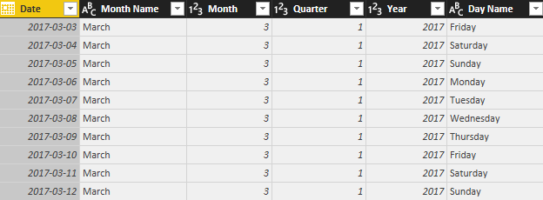
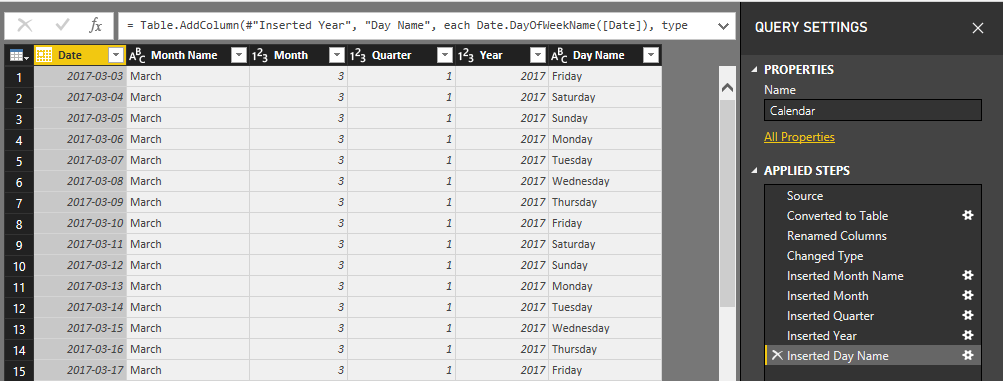
Adding Date Fields
The last step in creating the date dimension is adding the other date columns. The is made very easy using the Power Query editor interface.
After selecting the date column, I navigated to the Add Column tab on the ribbon. From there, I navigated to the From Date & Time section and selected the Date drop down menu.
From here, I selected the date columns I needed to populate the date dimension table.
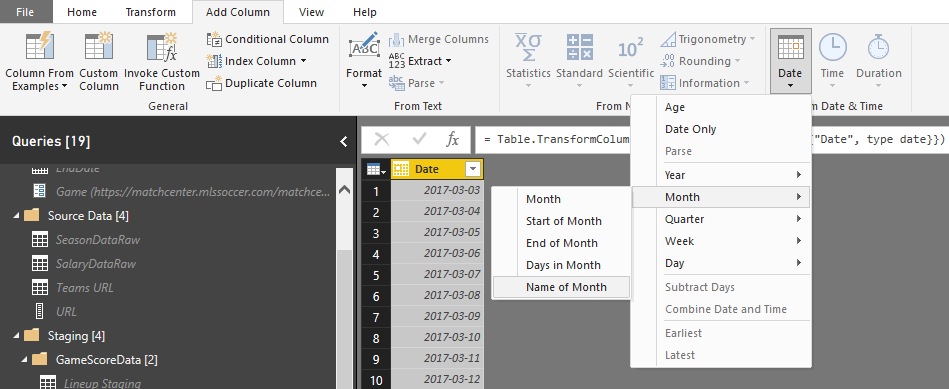
I selected five columns at the day, month, quarter and year level of granularity. The end result was a clean table generated dynamically from the data.
That is my take on creating a date dimension table in Power Query. I used these steps to create the date dimension table in my upcoming project and submission for the Year in Review Contest. I will publish my submission with a write up for my blog post next week!