A What If Parameter allows for the visualization and analysis of the effects of a change in a variable.
The example I use in this post is a salary cap projection. A fictitious sports team has historical data tracking a rising salary cap and total roster spend over the past seven years. There is also a projection of both variables over the next three years.
But what if these projections are wrong? Incorporating a what if parameter into the report allow for easy visualization of different projection scenarios.
Building the Parameter
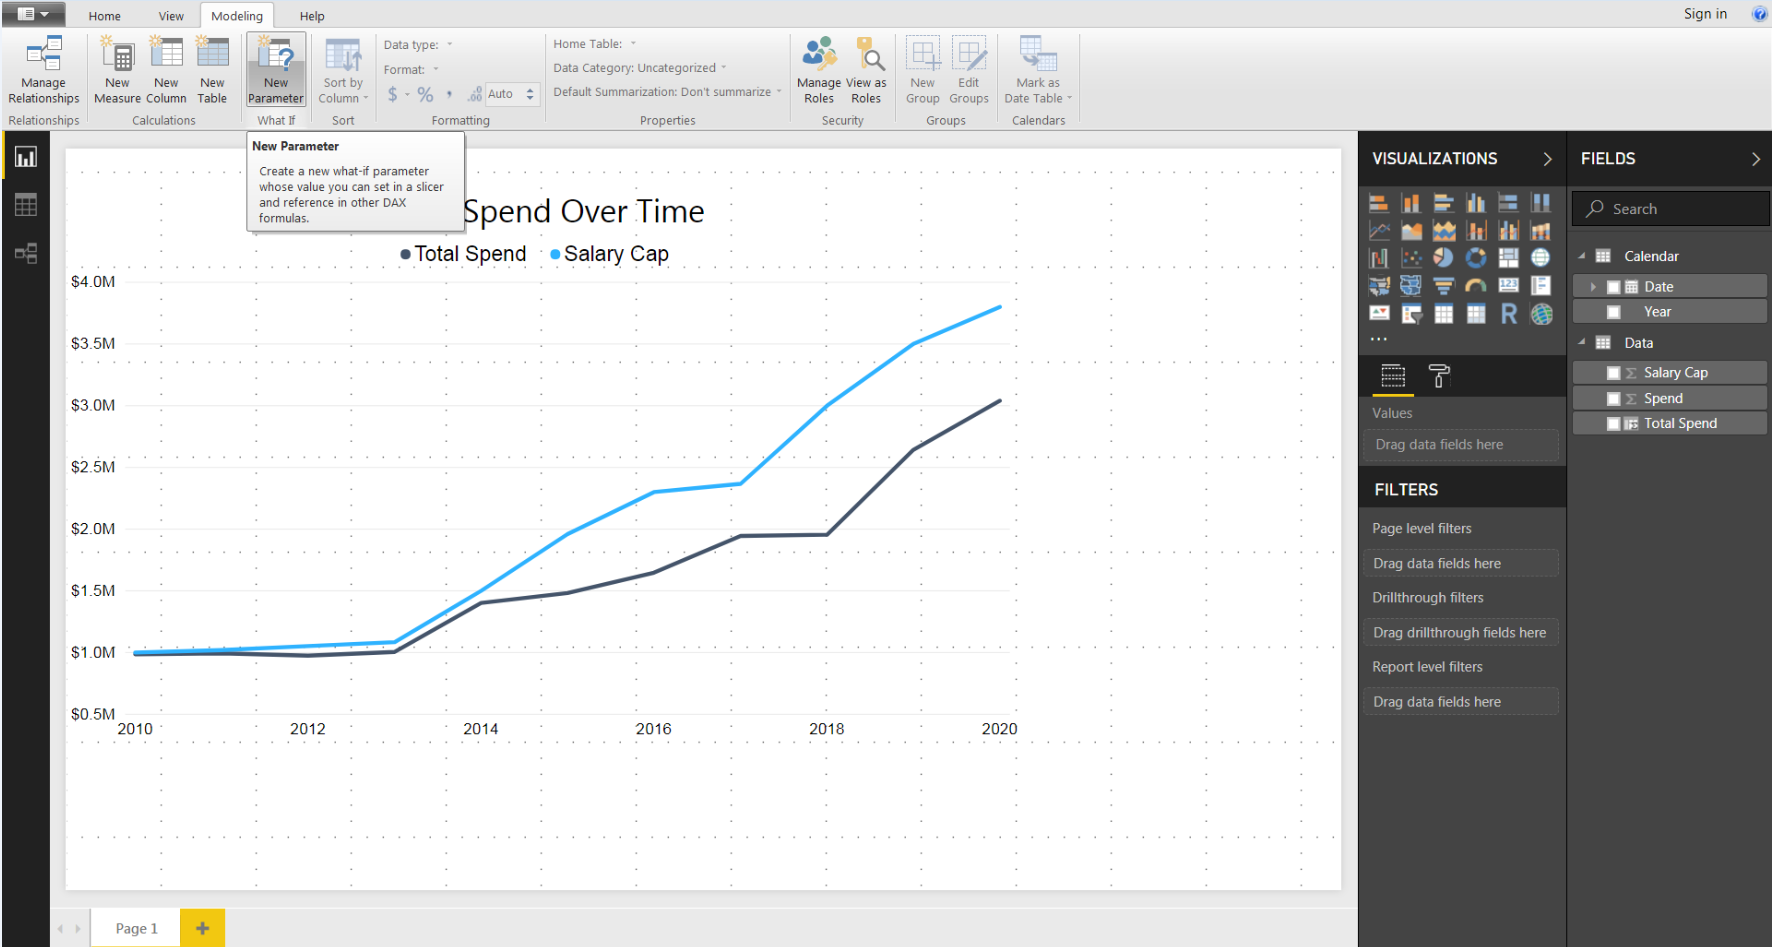
The first step towards using a what if parameter is to build one. I navigated to the Modeling tab on the ribbon and selected New Parameter from the What If section.
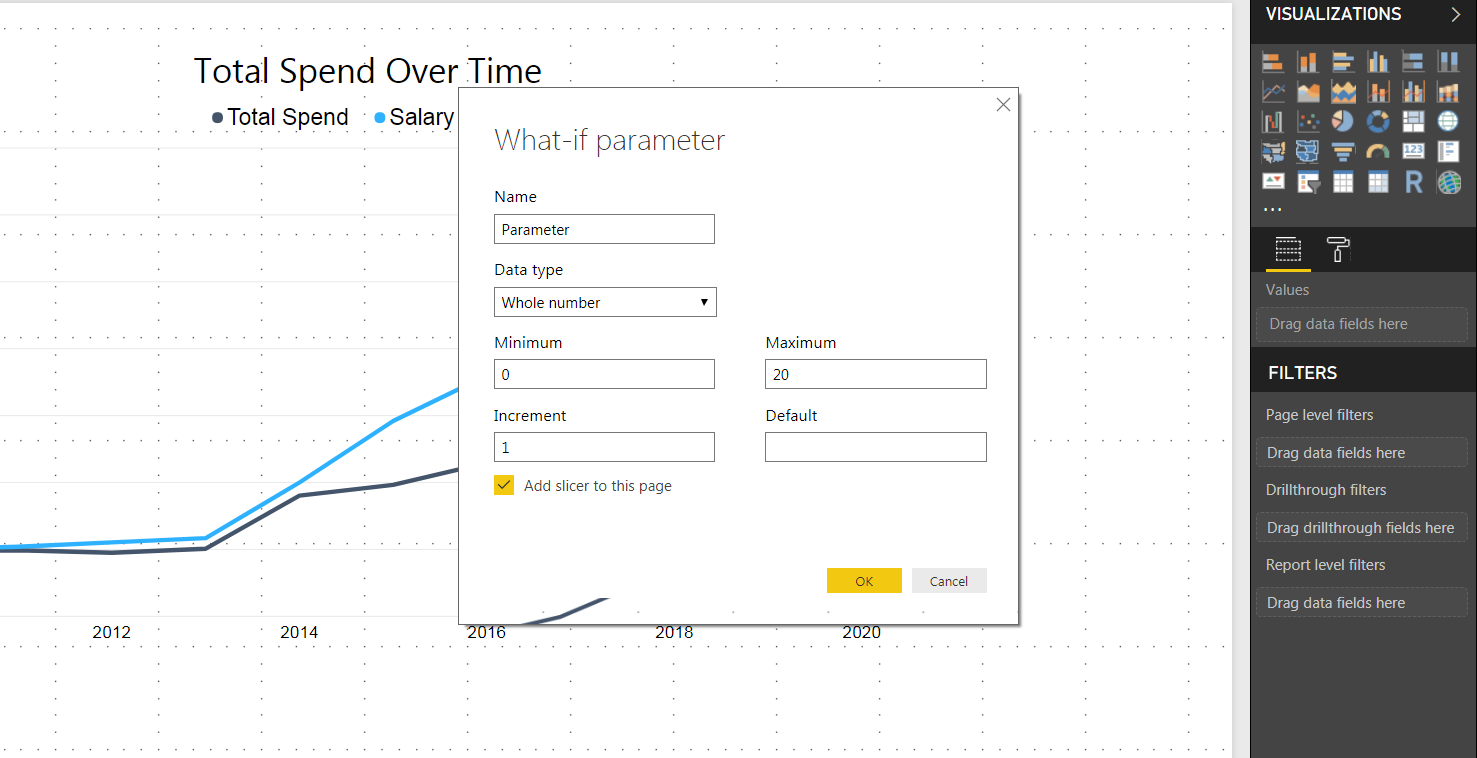
This brings up the pane to create the parameter. There are several aspects to define:
- the name of the parameter
- the data type
- the minimum and maximum values
- the increments between these two values
- the default value of the parameter
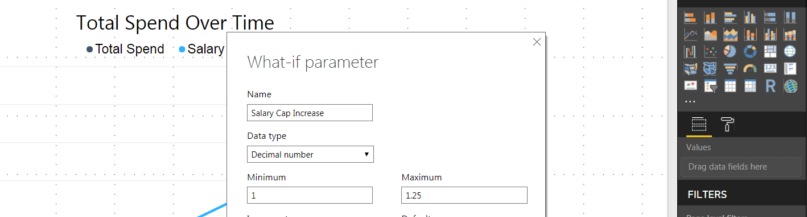
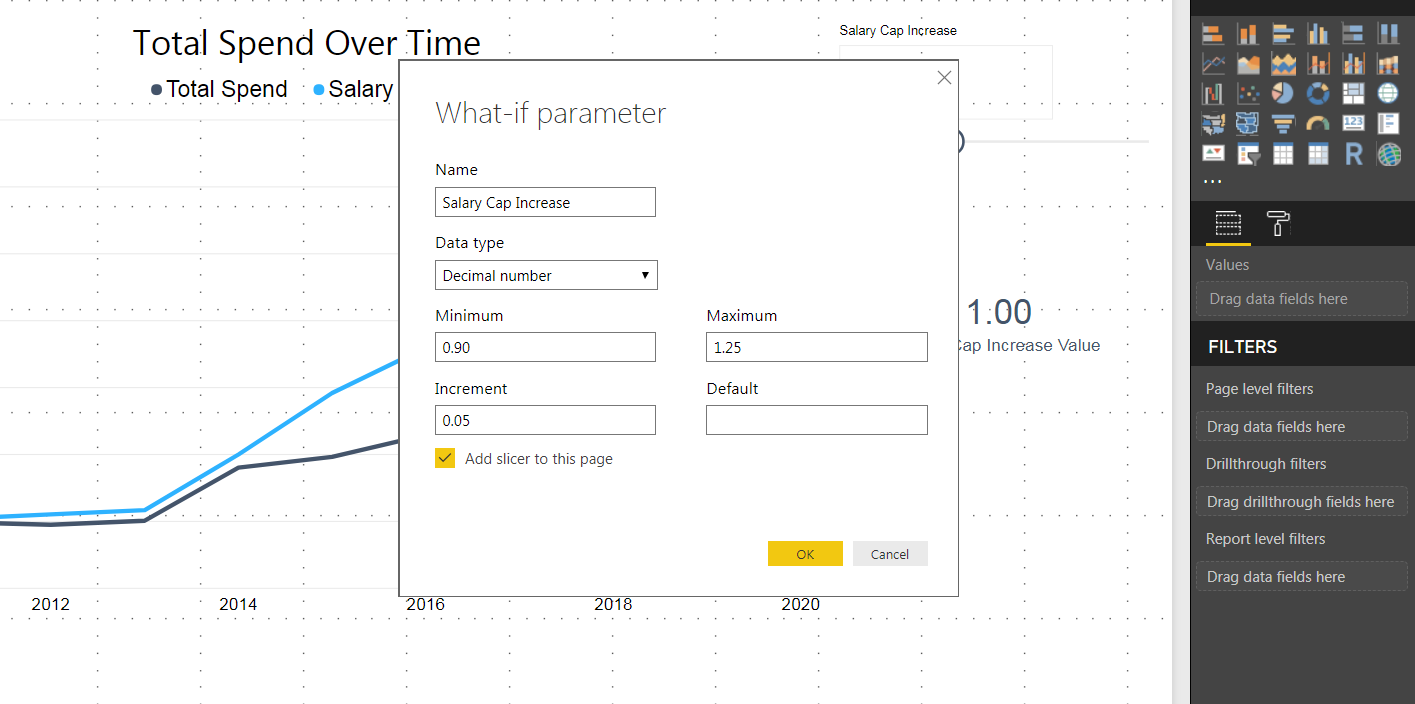
The parameter I wanted to create was the variance in the salary cap projection. I set the data type as a decimal number, to capture the percent difference from the projection.
The minimum value was set to 0.90, in case the salary cap came in under the projection.
The maximum value was set to 1.25, or 25% greater than the projection.
Visualizing the Parameter
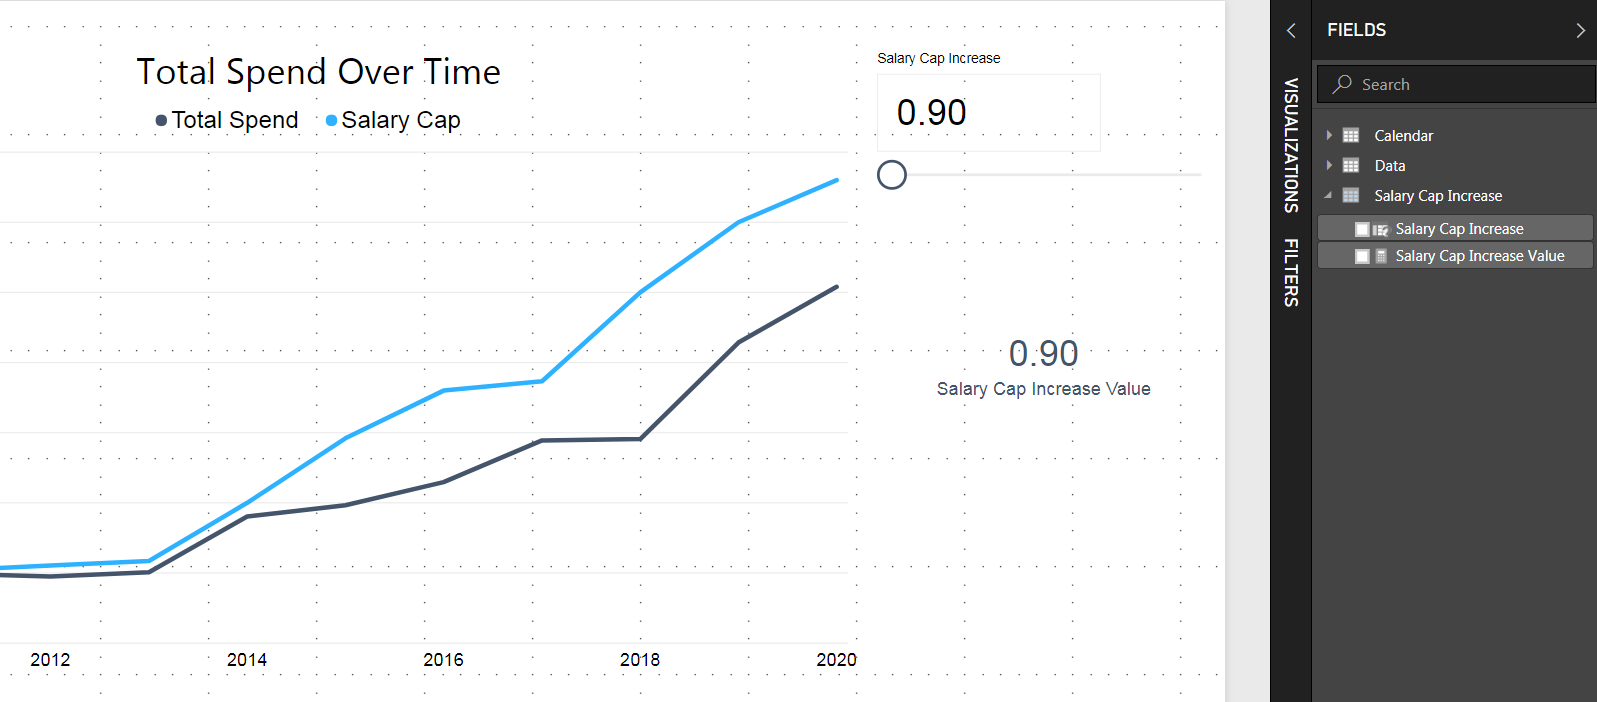
Two items appeared in the Fields pane after creating the parameter.
- Parameter Series (Salary Cap Increase)
- Parameter Measure (Salary Cap Increase Value)
The parameter series created the possible values to populate the measure. It is generated with the following DAX code:
= GENERATESERIES(0.90, 1.25, 0.05)
The series is visualized as a slicer on the report canvas to change the parameter and see the results.
The parameter measure is what can be incorporated into visuals, or referenced in other measures. I have included the measure with a card visual.
Building on the Parameter Measure
At this point, I had built a measure that changes with the slicer in the report. To leverage this measure in my analysis, I needed to build a new measure incorporating the parameter measure.
I created a new DAX measure called Adjusted Salary Cap. This dynamically changes the value of the salary cap projection based on the value of the what if parameter.
I built the measure with the following DAX code (after a lot of help from this YouTube video):
= SUMX(Data, IF(RELATED(Calendar[Year]) > 2017, Data[Salary Cap] * 'Salary Cap Increase'[Salary Cap Increase Value], Data[Salary Cap]))
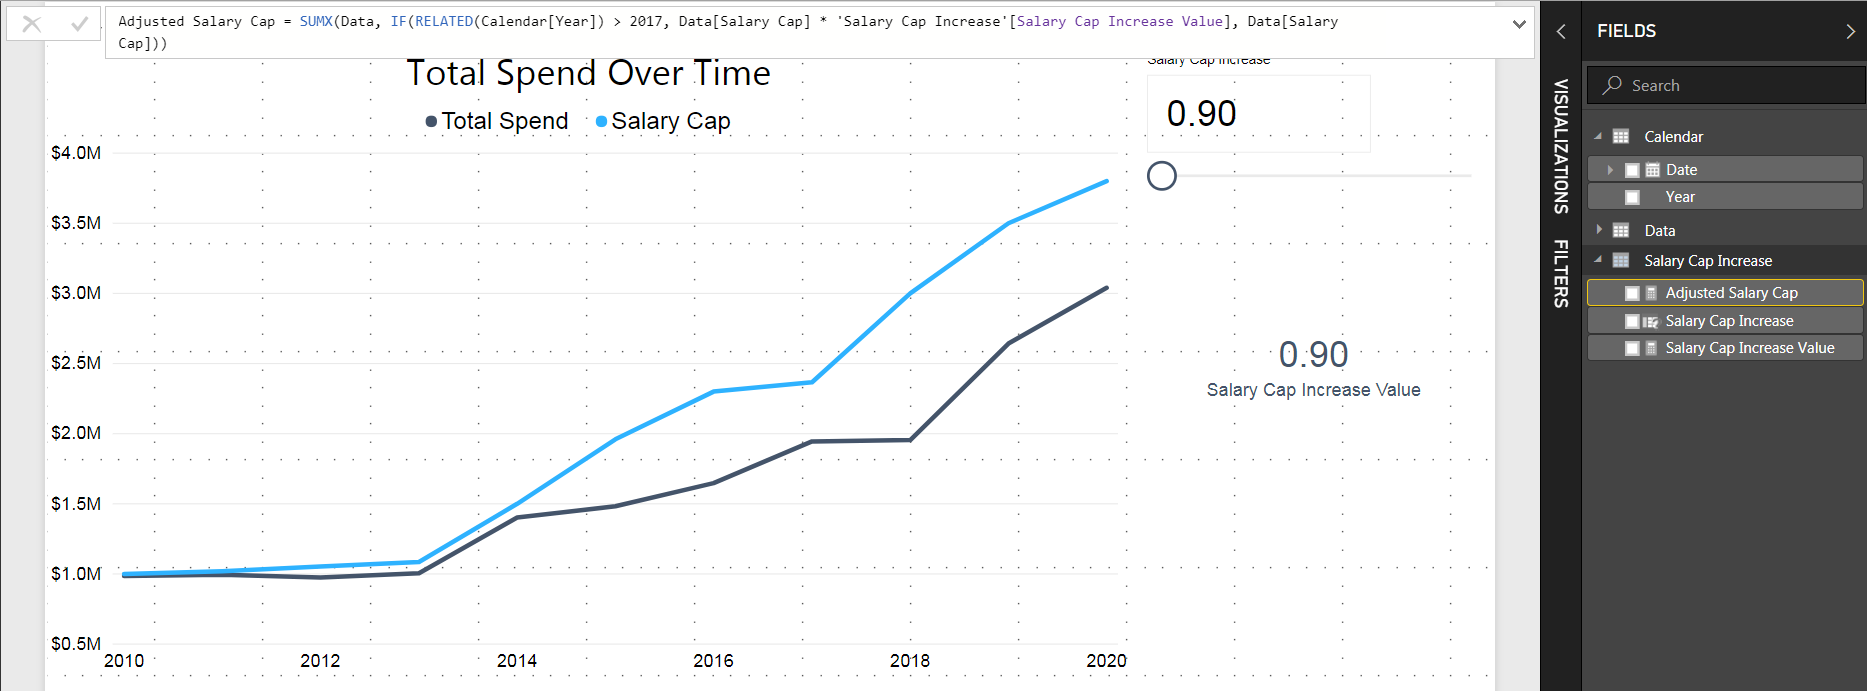
This measure multiplies the existing projection by the change in the parameter for all future years. All previous years will return the historical salary cap value.
Visualizing New Measure
Now that I had a DAX measure that includes the dynamic what if parameter, I visualized it.
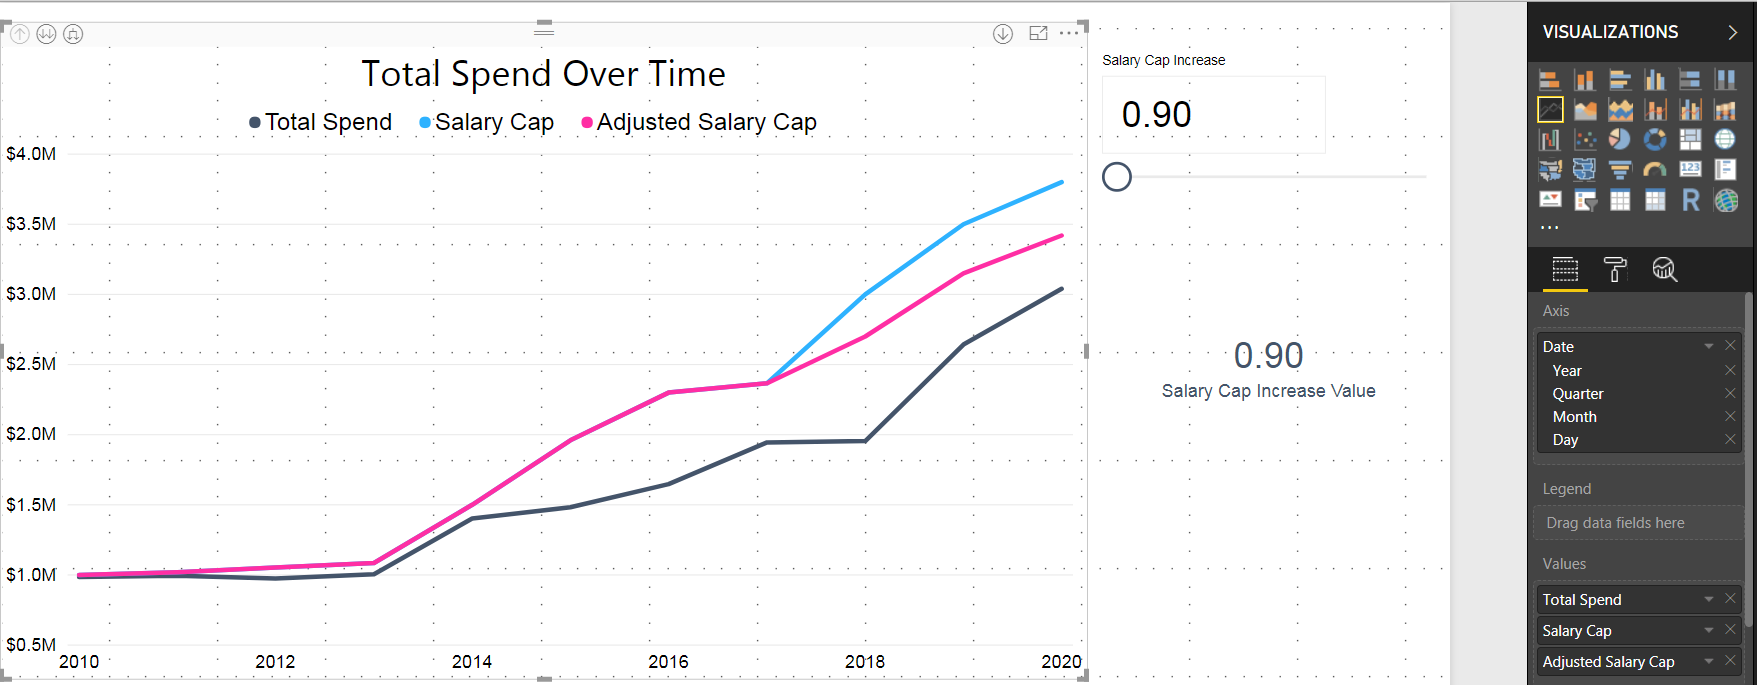
The existing line chart plotted the salary cap in light blue and the total roster spend in darker blue over a ten year period.
The Salary Cap and Adjusted Salary Cap lines had the same value from the years 2010 to 2017. The lines differed in all future years, depending on the value of the parameter.
I set the Salary Cap Increase parameter to 0.90 with the slicer, the minimum value. This changed the Adjusted Salary Cap measure that I had plotted on the line chart to below the existing projection.
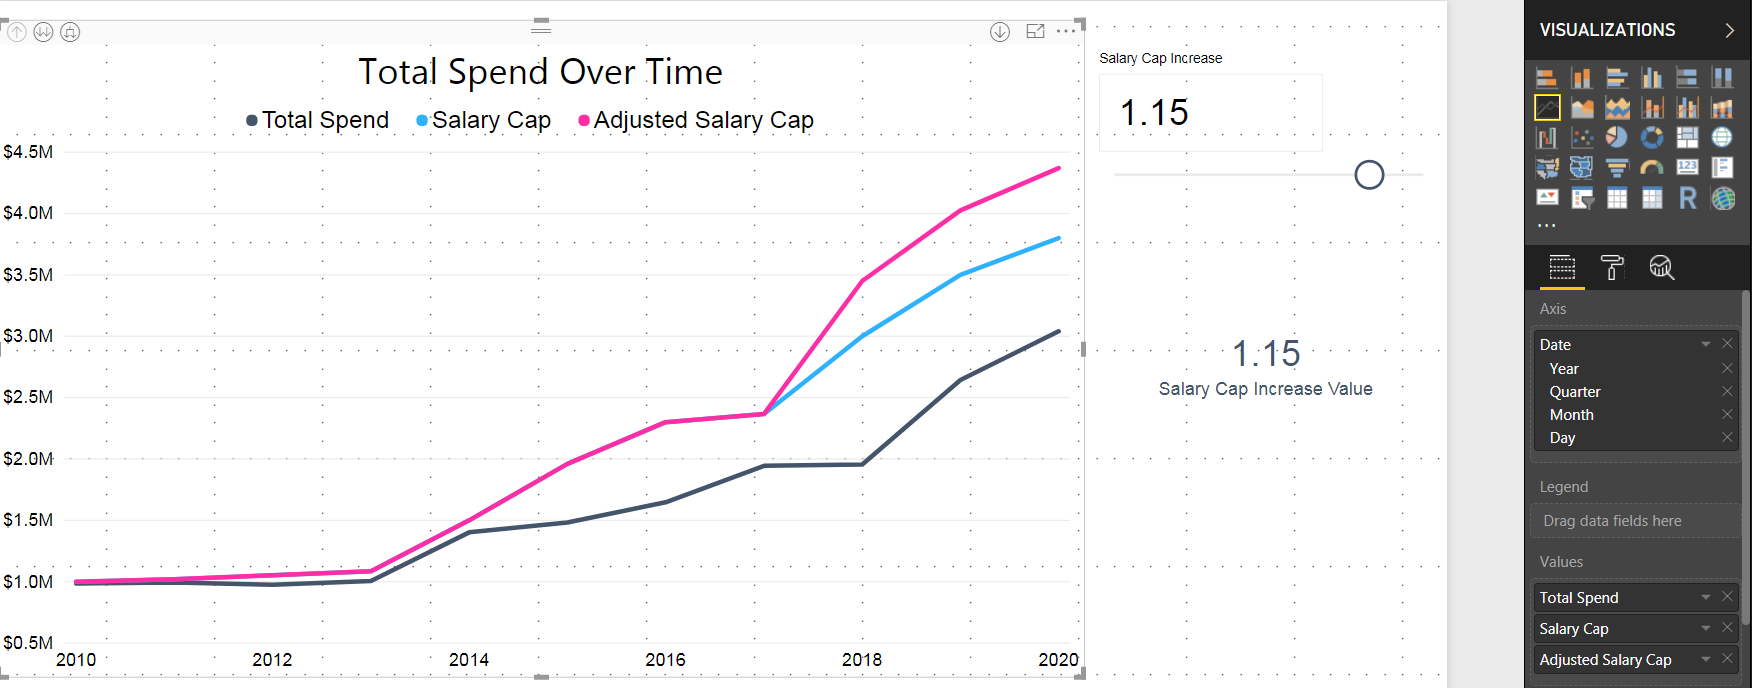
When I changed the slicer to 1.15, the pink Adjusted Salary Cap measure shifts above the blue projected Salary Cap line. If this projection holds true, there will be more salary cap room for the team to spend on the roster.
That’s my take on setting up a what if parameter in Power BI! Thank you to everyone who voted in my Twitter poll last week that determined this topic.
Make sure to follow me on Twitter @FthrsAnalytics to stay up to date with my website and other exciting news!
Hi joseph,
That’s a really great post and it’s really helped me wit an issue I was having but I was wondering if you could help me a bit as I’m getting stuck on a problem have.
I’m trying to do some predictive forecasting with parameters but I’m coming across an issue when using parameters into the future. What i’m trying to do is forecast the amount of people on a waiting list in the future but this can be altered by using parameters which will remove more than forecast. So for example, I have 100 people on a list in Jan 150 in Feb 200 in March etc, and I can forecast these out fine, I can even add in the parameter to for a what if (Extra Clinic), but the problem with the what if is that if I change the what if variable, it changes all the past information too, and I only want to change the future forecast.
The data contains a record for each person on the list so for January I have 100 records and so on, so I created a distinct count measure of patients (No. Of Patients) to get me the total number in that month.
I found this formula which kind of works but instead of taking the distinct count of the values at the point it takes all the records. The sn_cal_month_id is the date rage.
Here’s the query:
WL Prediction Parameter = SUMX(Query1, IF((Query1[sn_cal_month_id]) > 201801, ‘Query1′[No. Of Patients] – ‘Extra Clinic'[Extra Clinic Value], Query1[No. Of Patients]))
So instead of getting just a figure removed off a single month, it removes the entire amount of records from the graph.
Any idea what I’m doing so horribly wrong?
Thanks,
Hi Michael, thanks for the question! Based on what was provided above, I think the issue might be with the logical comparison of the date range to a specific date.
I built the following DAX measure to replicate your example and it seemed to work:
Forecast = Var NoOfPatients = DISTINCTCOUNT(Patients[PatientID]) var Forecast = NoOfPatients – ‘Extra Clinic'[Extra Clinic Value]
Return IF(MAX(‘Patients'[Date]) < 2019-01-01, NoOfPatients, Forecast) Please let me know if this helps!
Hi Joseph,
Thank you so much for that – it really does seem to work and it removes that value off all the forecast values. It’s great to see it working
Is there any way to get a cumulative effect? – Where the forecast drops the next month based on what was taken off the previous month? So for example, I have 100 people on in January, I use my Extra Clinic variable to remove 5 from Jan, so it will remove 10 from the Feb, 15 from March etc.
Is that possible?
Thanks,
Micheal