I’m excited to be sharing the contents of this post at the Vancouver Power BI User Group this month! The full feature list for the update this month can be found here. My favorites this month come from the areas of reporting, visualization, and data preparation.
Curate featured tables for Excel (preview)
This is a really cool feature that allows report authors/admins to make the information from a table in a Power BI data model available for Excel users to enhance their analysis!
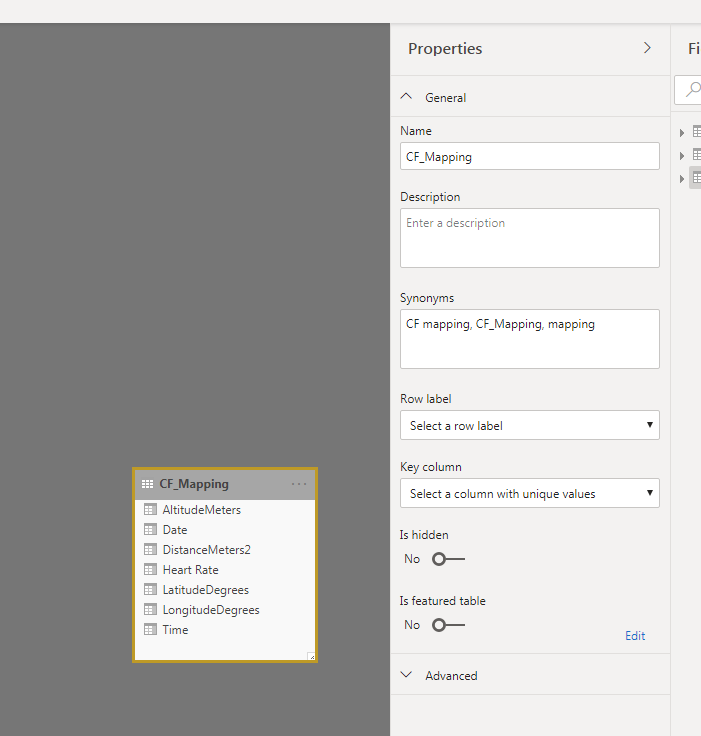
To enable this functionality, I navigated to the Model View in Power BI and selected the table I wanted to feature. Then I toggled the “Is featured table” option to Yes.
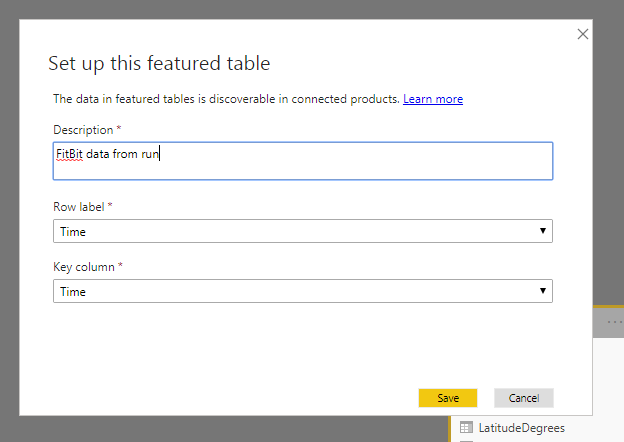
This brought up the following dialogue box. This allows you to set two important items:
- The row label that will be input in Excel to bring in the additional information that pertains to that label
- The key column of the table – the unique identifier
This is now set up and ready to be accessed in Excel! An important point to remember is that “Allow connections to featured tables” must be set to enabled for this to work within your organization.
Drop shadow support for visuals
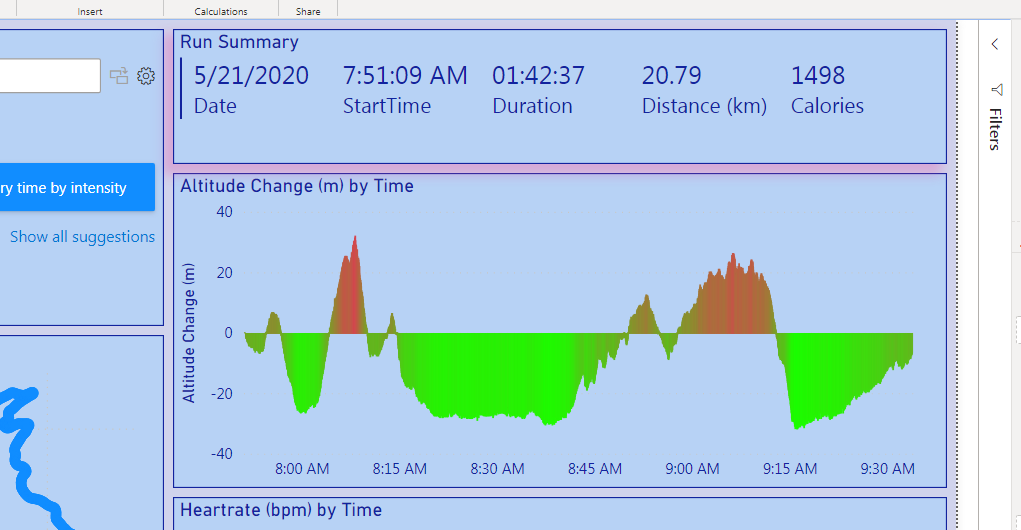
This feature brings depth to the visuals on a report page and creates a better viewing experience for the report user.
To set up drop shadow on a visual, I navigated to the format pane of the visualizations tab and toggled on the new Shadow section.
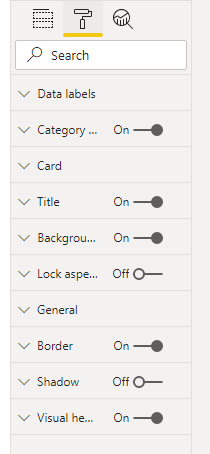
This brings up the option to set the color, position, and preset of the shadow.
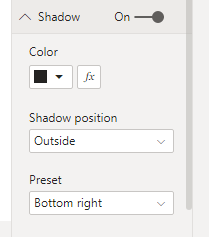
I set a bottom left, outside and pink shadow to the visual. This opens up a few possibilities in the blank space between visual in a report and lets the visual pop off the page.
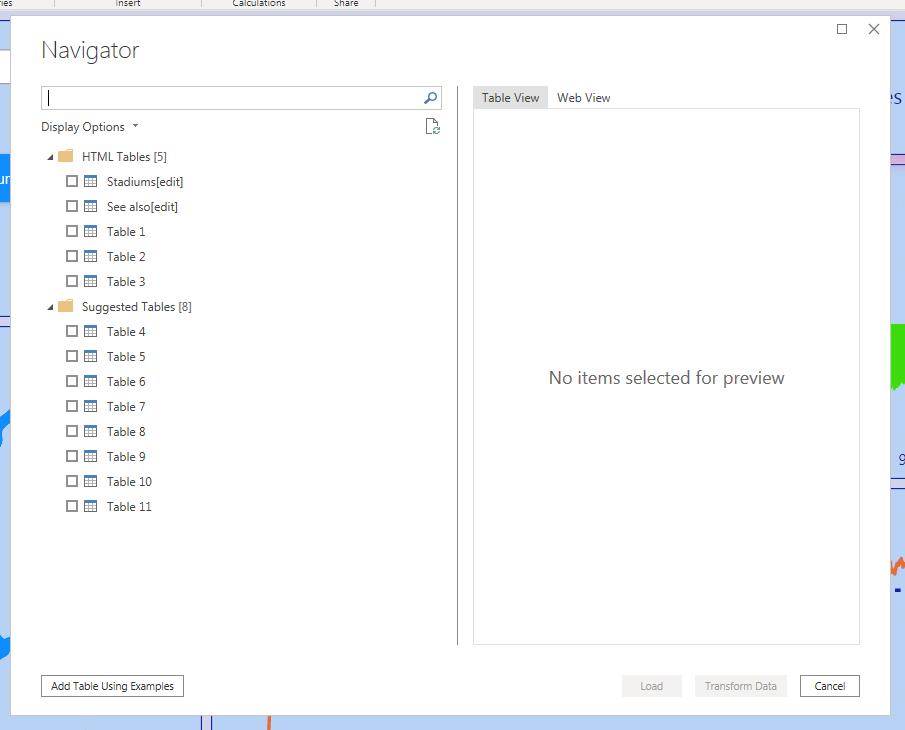
Web by example now automatically suggests tables by default
This is a small change that has a big impact! By default, tables are suggested when connecting to data from the web. I almost always am looking to bring data from tables into the Power Query Editor when connecting to web data sources, so this will be helpful for me!
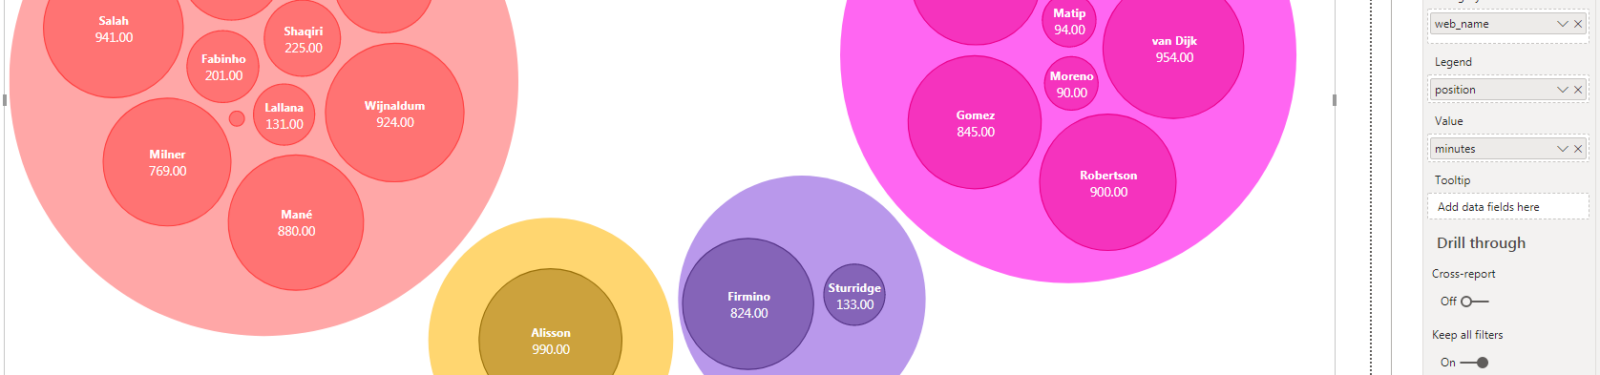
Packed bubble chart by xViz
I have played around with this visual previously in Tableau, so it’s nice that there is now an equivalent in Power BI!
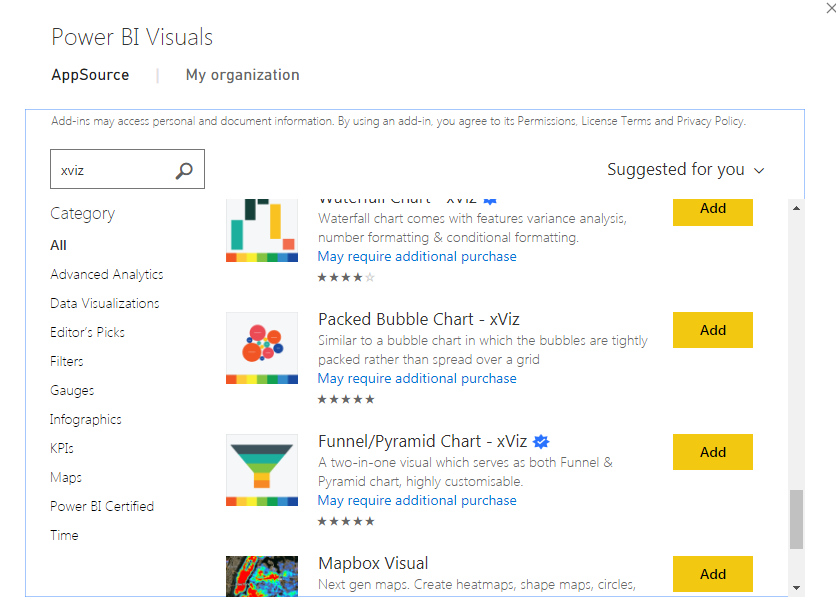
To download the visual, I went to the add visual options from the visualizations pane and selected from the marketplace.
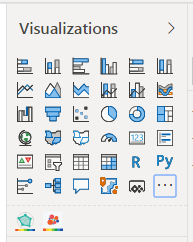
I searched for xViz visuals and selected the packed bubble chart.
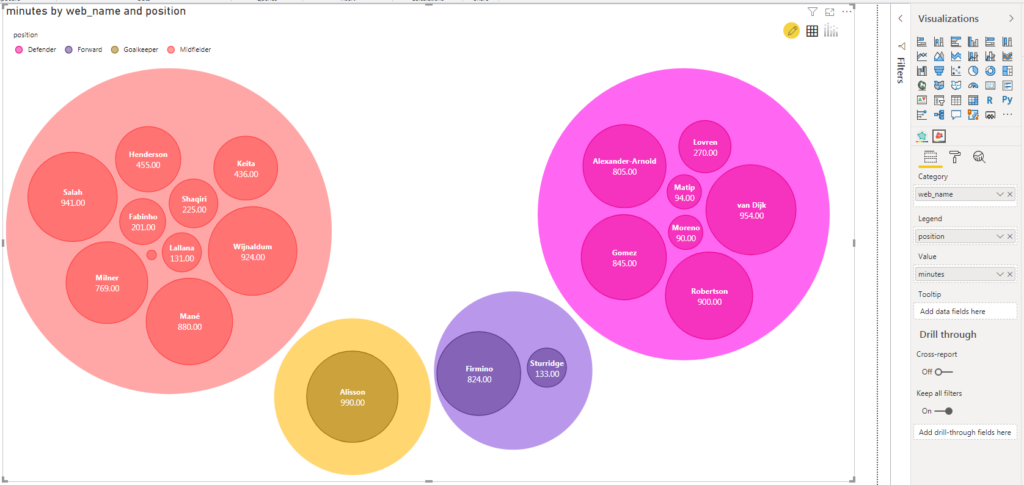
From there, I added the category, legend and value field to create the visual! As usual, there are quite a few formatting options. My favorite was to visualize the data as category bubbles within the larger legend bubbles.
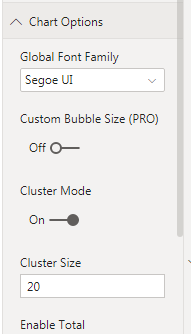
To enable this, I went to Chart Options and toggled Cluster Mode to on.
Those were my favorite features from this month’s release of Power BI Desktop. I’m looking forward to sharing these features at the Vancouver Power BI User Group. The June feature release should also be out by then, so I might have two months worth of features to present.
1 thought on “What’s New in Power BI – May 2020”
Comments are closed.